We don’t yet know exactly what will unfold later this afternoon/evening in terms of the heights reached for QLD ‘Market Demand’ on Friday 24th January 2025 (so we might report that later), but I was curious in terms of supply-side performance of units over the past 4 days in Queensland – including the extreme demand period of Wednesday 22nd January 2025…
Overview across all QLD
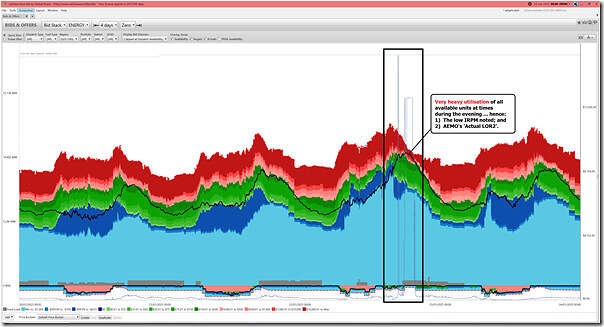
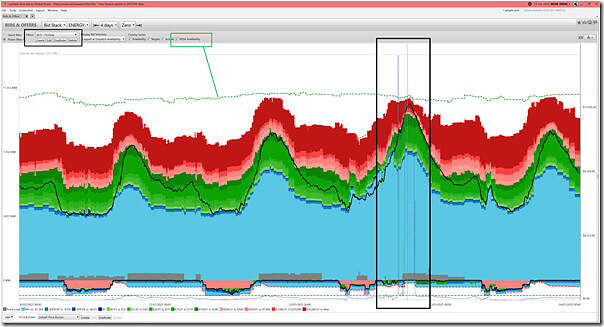
Across all Scheduled and Semi-Scheduled units (i.e. Non-Scheduled units and smaller non-registered units are invisible in this form, as they do not bid) we can use the ‘Bids & Offers’ widget in ez2view to review a concatenated view of all units available to inject into the QLD grid over a 4-day period … of which we’re particularly going to focus on Wednesday afternoon/evening 22nd January 2025:
We’ve time-travelled back to 00:00 beginning Friday 24th January 2025 (i.e. today) and are looking back 4-days. Initially we’ve filtered down to look at all units in QLD (100 of them).
Remember to click on an image to open a larger-resolution view.
By ‘Fuel’ Type
To match with the increasingly used paradigm of the energy transition, we’ll separate these 100 units into VRE and Firming…
VRE (Variable Renewable Energy)
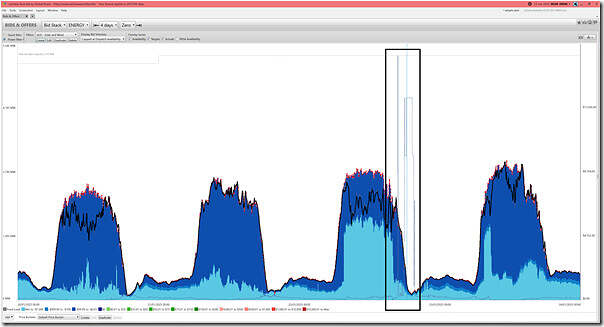
Let’s start with VRE, as follows
… and we can clearly see there’s both ‘glass half full’ and ‘glass half empty’ stories here. So now let’s unbundle further…
Small-scale Solar PV (i.e. rooftop <100kW)
In this three-day trend of the supply-side fuel mix, we already noted that rooftop PV contributed a small (but important) amount of energy at the time of the evening peak in demand (i.e. such that the ‘Market Demand’ would have been lower than it would otherwise been.
Medium-scale Solar PV (i.e. >100kW to ~10MW)
Separate from that, note that ‘medium solar’ is essentially invisible … though we can assume it was similar in pattern to ‘small solar’.
Large-scale Solar PV (i.e. Semi-Scheduled)
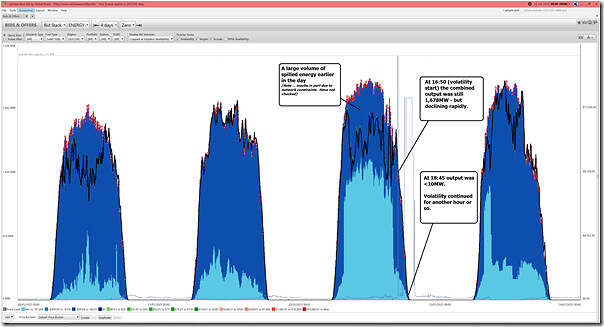
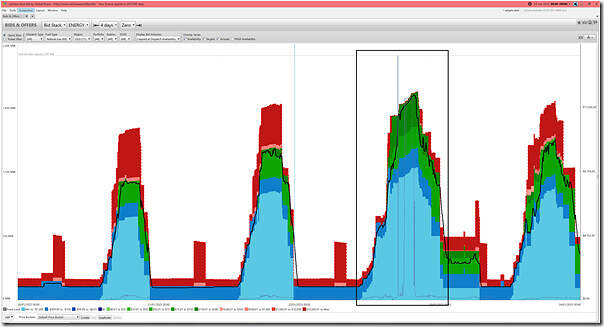
Large Solar are Semi-Scheduled units and so are visible in their bids:
We see that Wednesday 22nd January 2025 was a strong indication of the need to convert many of these Large Solar Farms in QLD to hybrids with the addition of battery storage:
1) Earlier in the day we see a large volume of spilled energy:
(a) for reasons not explored at this point.
(b) But approaching 900MW at times
2) During the period of volatility:
(a) At the commencement of volatility (16:50), output was ~1,600MW but declining fast
(b) Two hours later, with prices still high, the solar was done
(c) And volatility persisted for another hour or so.
Wind Farms
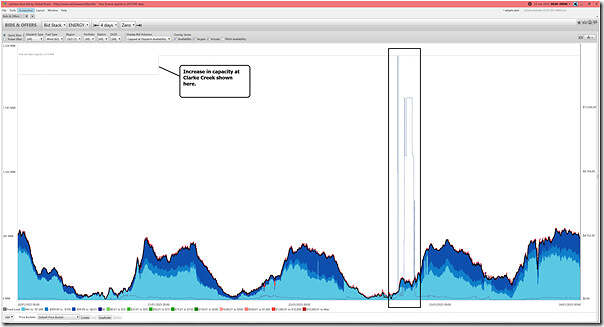
Wind Farms are Semi-Scheduled units and so are visible in their bids:
The summary story here is that none of the wind farms performed all that well during the (volatile) period in question … but there’s some more devil in the detail, some of which we can note here:
1) Remember that some Wind Farms are in commissioning, so it would be wrong to count all their capacity during this period.
(a) Like Clarke Creek:
i. which increased capacity registered over this 4 day period (to 338MW), coincidentally
ii. but note that it did produce something, so is not totally 0MW.
(b) MacIntyre Wind Farm (Max Cap = 890MW) actually ramped up from ~0MW to ~60MW during the volatility and is clearly still in commissioning, so not sure how much its ‘true’ installed capacity is at this time.
(c) So subtracting all of the above (890+338) off 2,214MW to arrive at 986MW understates a level of ‘true’ capacity installed and operational on the day.
(d) But if we assume this and note peak aggregate output was just under 200MW (i.e. including contribution from the two in commissioning, which we don’t count in the denominator) then we see this as an overstated peak capacity factor of 20%.
2) Other wind farms that are fully commissioned performed quite poorly during Wednesday evening 22nd January 2025. Noting:
(a) Coopers Gap was down to 0MW during some periods of volatility (have not looked if due to low wind or other factors – such as potential high-temperature limitations
(b) Dulacca Wind Farm produced quite low output (again down to 0MW at times) during the volatility, but this was book-ended by running flat out on Wednesday morning and then from late night Wednesday
(c) Kaban Wind Farm peaked at 27% capacity factor during the volatile period
(d) Output at Kennedy Energy Park unfortunately dropped output to very low levels coincident with the volatility
(e) Mt Emerald Wind Farm did briefly peak at 50% capacity factor during the volatile period, but the output was quite up-and-down.
Bundling all of the above together (with Wednesday evening 22nd January 2025) as a Case Study points to a future VRE+Firming grid/market requiring combinations of:
In Future Required #1 = of an awful lot of storage;
In Future Required #2 = very large transmission connection south (matched with ‘spare’ capacity in NSW and further south that’s available for export north); and
In Future Required #3 = other (non shallow storage) firming capacity.
Firming
Let’s now move from VRE into a look at the Firming Capacity that was able to be operated on the day … both old and new. Here’s an aggregated view.
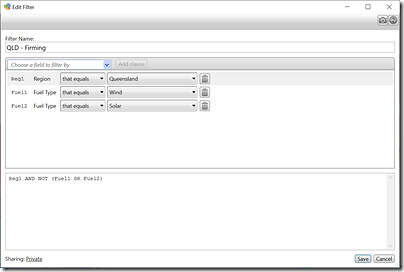
This was prepared with a ‘Power Filter’ like this:
There’s plenty of stories in the aggregated trend above, so let’s disaggregate further …
Fossil-fuelled firming (coal)
Of keen interest to many (including those at both extremes of the Emotion-o-meter) will be the performance of the QLD coal-fired units (there are 22 of these … of the 44 coal units in total still operational across the NEM):
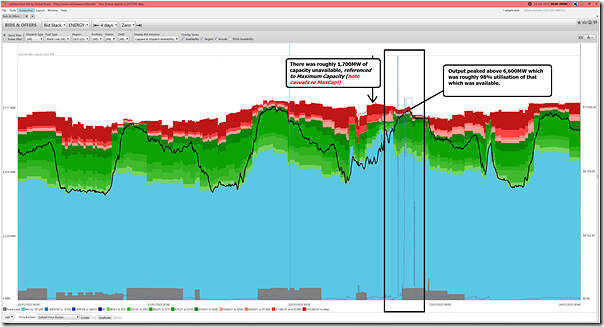
Let’s look at the three key measures many readers will be interested to track:
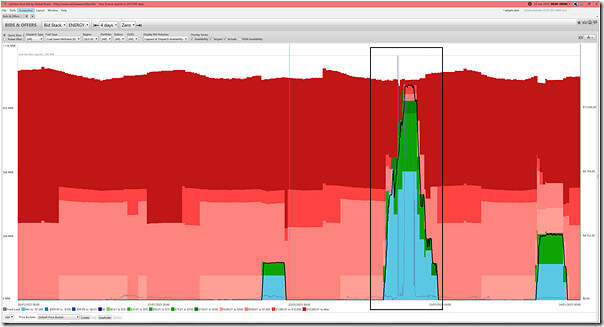
1) In terms of utilisation, we see that almost all of the coal energy offered to the NEM during this period was utilised – peaking around ~98% utilisation (i.e. almost no ‘spare’ capacity)
2) With respect to availability, we see that there was ~1,700MW of coal unit capacity in QLD that was unavailable. We can understand that this falls into at least 3 buckets:
(a) Of the 22 units, there were two units unavailable during the evening period on Wednesday 22nd January 2025:
i. The Tarong North supercritical unit (MaxCap = 480MW) was offline on an unplanned outage since the last weekend.
ii. The GSTONE6 unit (MaxCap = 280MW) had been offline since the morning of Monday 20th January.
iii. Remember that we previously noted that the GSTONE2 unit (MaxCap = 280MW) came offline at 19:31 (NEM time) on Wednesday evening (and was back online early the next morning)
iv. So 1700-480-280 = 940MW unavailable due to partial unit unavailability
(b) Remember that the temperature (and humidity) were stifling, and that like all technology types, coal units experience high-temperature limitations that reduce their efficiency and availability.
… perhaps in a subsequent article we can try and unpack for specific units the extent to which temperature (or other factors) were at play.
(c) Worth also remembering what we noted as ‘Analytical Challenge – choosing what measure to use, for ‘Installed Capacity’’, and that for some coal units (the lower) Registered Capacity is a better measure of MCR (Maximum Continuous Rating).
… I’ve not looked at the extent to which this was a factor here.
3) As we can see in the coloured bid stack chart, almost all of the available volume was offered in ‘blue’ and ‘green’ price ranges … essentially showing that these units were bid to run as much as possible. Hence the high utilisation noted above.
Fossil-fuelled firming (gas and liquid)
We could have combined them all with the use of a ‘Power Filter’ in the ‘Bids & Offers’ widget in ez2view and seen all non-coal fossil units together, but I took the ‘Quick Filter’ route to see them in three bundles as follows…
So we’ll start with the ‘Fuel Type’ = Natural Gas selector (which includes 8 different stations):
There are 11 x DUIDs in this set – we see heavy utilisation, but with respect to availability we see:
1) Just prior to 17:00 on Wednesday 22nd January 2025 (i.e. when the volatility started) we see unavailability of ~400MW
2) We also see that this reduced in the hours following … perhaps this might have been due to (somewhat) cooling of temperatures reducing high-temperature limitations (but this has not been checked).
Next, let’s look at the 6 x Braemar units, which are categorised as ‘Fuel Type’ = Coal Seam.
We can see that these units ran heavily on Wednesday evening 22nd January 2025 (much higher than on Tuesday 21st January 2025 or Thursday 23rd January 2025)
Finally, let’s add in the view for the Mt Stuart peakers, which are categorised as ‘Fuel Type’ = Kerosene.
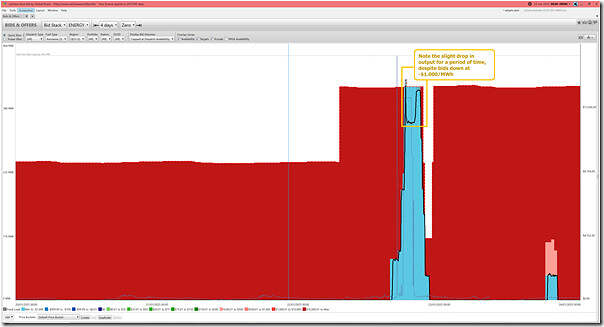
These units ran heavily on Wednesday evening 22nd January 2025 (and slightly on Thursday evening 23rd January 2025) … and were bid up near the Market Price Cap otherwise.
Batteries
Here’s a stack of all the batteries (now all operating as bi-directional units, as noted by Linton earlier this week).
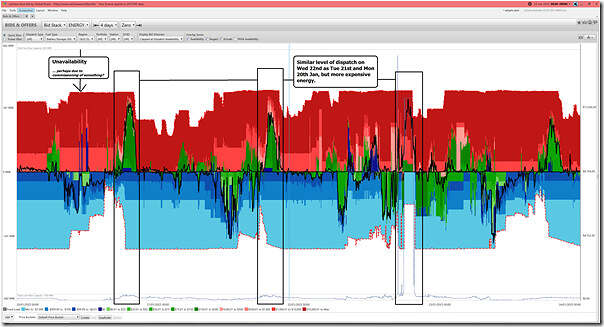
With battery units, note that they experienced a burst in output on Wednesday evening 22nd January 2025 (but that this was not too dissimilar to that seen on Monday evening 20th January 2025, and slightly more than on on Tuesday 21st January 2025 or Thursday 23rd January 2025).
1) In contrast, however, on Wednesday evening 22nd January 2025 was bid much more expensively than on the other days
2) I’ve not looked in detail but it might be that factors similar to ‘Theory #2’ were contributing.
It’s also notable that there was ~220MW of BESS discharge capacity unavailable through the entire 4 day period … of this, 200MW was for the GREENB battery (which I think is commissioning, so not really ready).
Hydro
Similarly to what we have done for BDUs in ez2view we also show both sides of the Wivenhoe Pumped Hydro scheme as part of the battery mix.
An interesting point, as a sidenote here, is the much stronger pumping operation seen in this unit these days compared to how they used to run in yester-year. Something to explore in more detail with the soon-to-be-released GSD2024, perhaps?
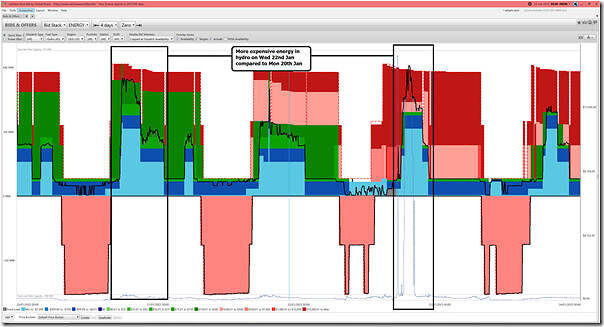
Also of interest was the change in bidding approach across the collection of hydro units in QLD on Wednesday 22nd January 2025 compared to Monday 20th January 2025.
Negawatts
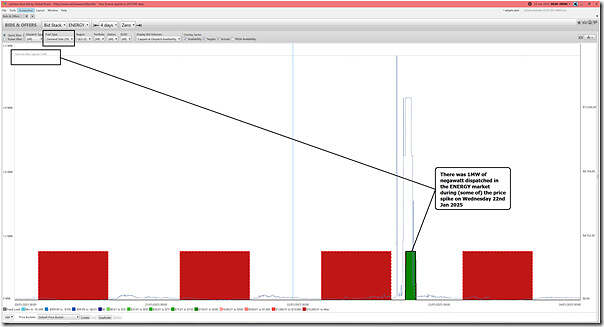
I almost did not bother to look, but as we see here, there was actually a sum total of 1MW dispatched through the period of the spike on Wednesday 22nd January 2025:
We’re dealing with small numbers here, obviously, but it’s also worth noting that the ‘Availability’ of registered Negawatts was only 20% as well (i.e. 1MW bidding of 5MW registered). Might be a useful metric to keep in mind in future discussions about the evolution of the NEM.


Actually, at the time of peak demand*, rooftop PV contributed nearly 2,800 MW of output Paul!
* That’s underlying demand of course, which hit something like 12,335 MW. Due to the high penetration of rooftop PV it’s inevitable that it won’t contribute much at the time of peak market demand – because market demand will only peak when rooftop PV is nearly done for the day.