In this article, we present a summary of the extent to which supply-side energy availability was utilised for energy dispatch on the 27th of November 2024 in NSW.
This was the NEM region where the greatest risk to supply was anticipated (recall the lack of reserve projections and events of the day).
Media announcements and changing network outage schedules indicate considerable work was done to modify, cancel or reschedule many network outages that were initially planned for the day to maximise transmission capacity and reserve levels.
So, how did dispatch make use of the available supply mix? How much of what was offered got used?
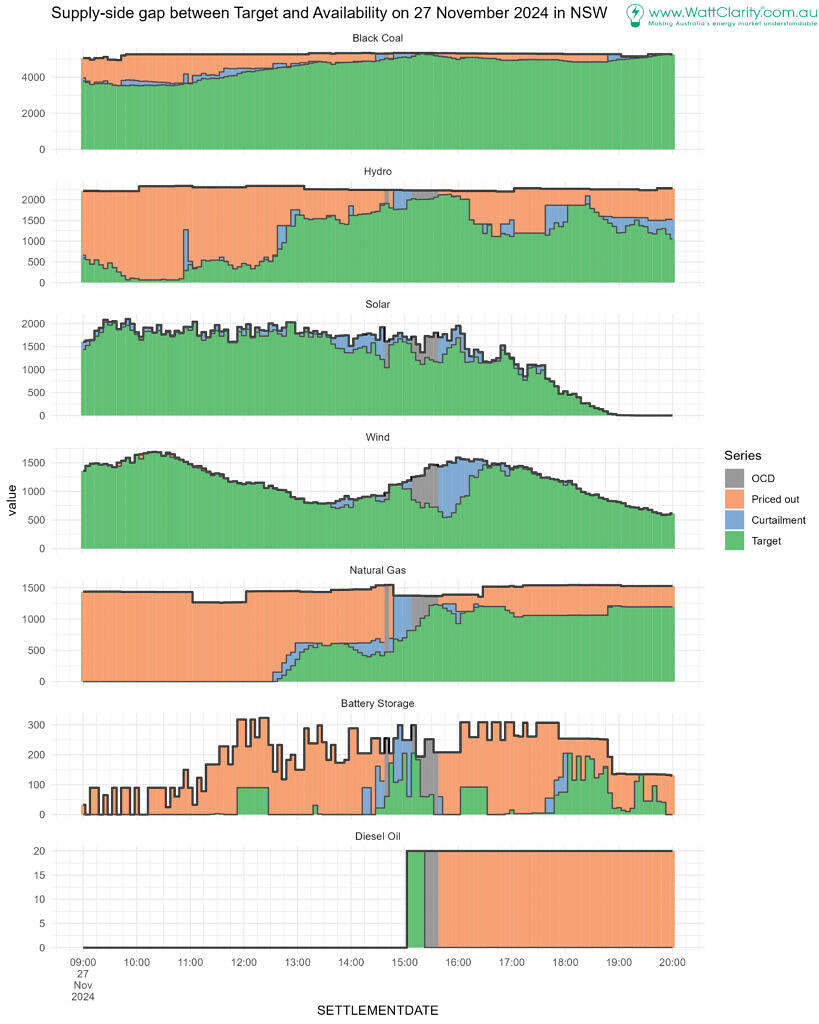
Aggregating by fuel type uncovers differences in use
Bid and dispatch data was processed and aggregated to summarise totals for:
- Dispatch Availability (the black line at the top),
- Dispatch Target, and
- The gap representing energy that was available but not dispatched, split into
- “Curtailment” (think power system restrictions such as network congestion),
- “Priced out” (think offered price was higher than the dispatching price).
The method follows Allan’s approach as described in Renewable curtailment – forced and not quite so forced. Note that, in the case of VRE (wind and solar) units, economic ‘offloading‘ was the term used instead of priced out. For VRE we can think of this as ‘offloading‘ available energy to avoid dispatch, typically when the energy price to be earned is low. We’ve used priced out here because we also cover non-VRE supply sources that have controllable input fuel supply.
On the chart there’s a fourth colour (gray) for when there was over-constrained dispatch (OCD). When OCD is resolved prices are redetermined by the dispatch engine. In such situations the price inputs that we require for determining the split are not available in the MMS.
Update: Note that we can expect the non-dispatched portion of availability under OCD conditions to be “curtailment’ in all the foreseeable situations that we are aware of.
Here’s the chart for eager eyes. We discuss each fuel type category below. But note, there’s more to know about what has gone into the data to prepare the chart. For this, see ‘The details’ section at the bottom.
Black Coal
A considerable amount of capacity was offline (outages) and that’s not shown in the top panel of the chart.
What is shown is the availability of the fleet that was in service, greater than 5,000MW typically, and peaking at 5,350 MW at 14:15.
Below the availability is a slice for “Priced out”. This represents availability that was not dispatched due to the offer price being too high. This is the main portion of available energy not dispatched.
There wasn’t very much curtailment at all throughout the period we have looked at.
During the main OCD period coal unit dispatch hit its’s peak, only 43 MW below full availability (0.8% not dispatched, relative to availability). This was at interval 15:20.
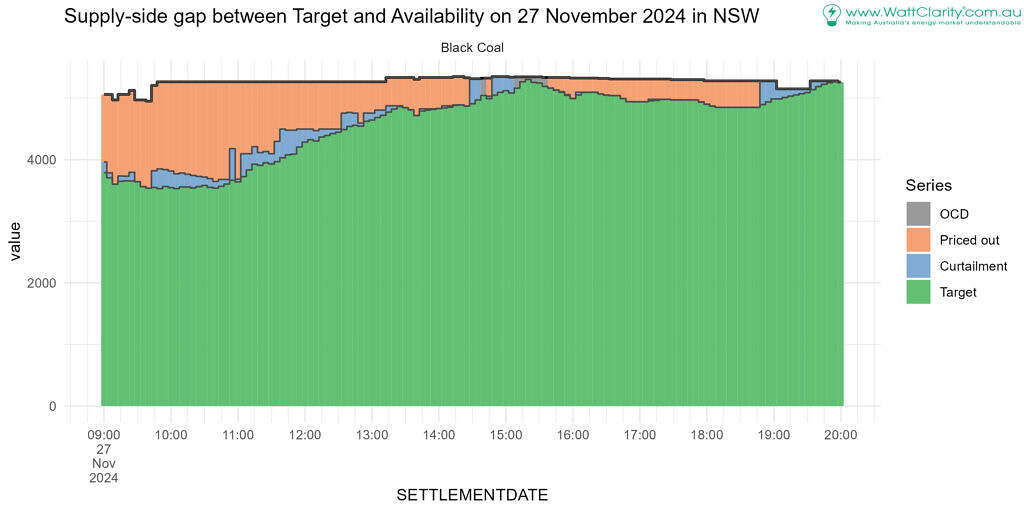 The chart ends at 20:00 but note that increase in aggregate target to almost 100%, again, by 20:00. This period aligns well with the absence of solar generation and a period of declining wind availability.
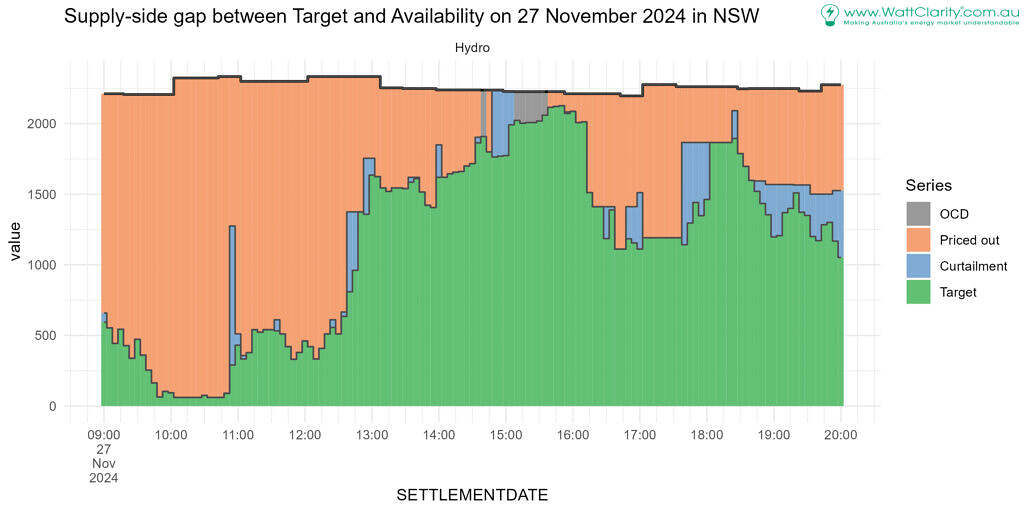
Hydro
The second biggest group, in terms of aggregate availability on the day, is Hydro.
This category tended to (as with coal) see dispatch in line with bids. On other words, typically, only offloading occurred.
There was a period where network constraints impacted supply and led to reduced targets for hydro units. This, appearing in blue, was 14:50 to 15:05.
One example of curtailment in this period was at TUMUT3:
Constraints impacting TUMUT3 included to avoid O/L Bannaby to Sydney West (39) on trip of Avon to Macarthur (17) line, and to avoid O/L Wagga to Yass (990) on trip of Wagga to Lower Tumut (051) line. These were binding.
At 14:50 TUMUT3 had 474 MW priced at $17 499.92 (at RRN). The RRP was $17,500 so, ordinarily, this would have been dispatched as it was priced below. Yet that volume was curtailed due to the constraints. The price TUMUT3 would have needed to bid at to see dispatch of that volume was (CPD price) $ 1,370.39. This was a primary (but not the only) contributor to the total “curtailment” in the Hydro Panel at the 14:50 interval.
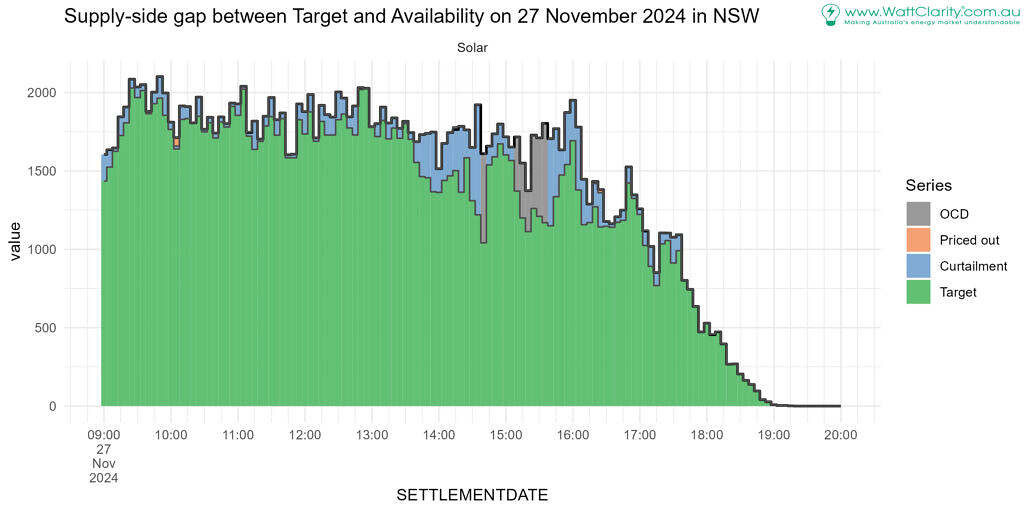
Solar
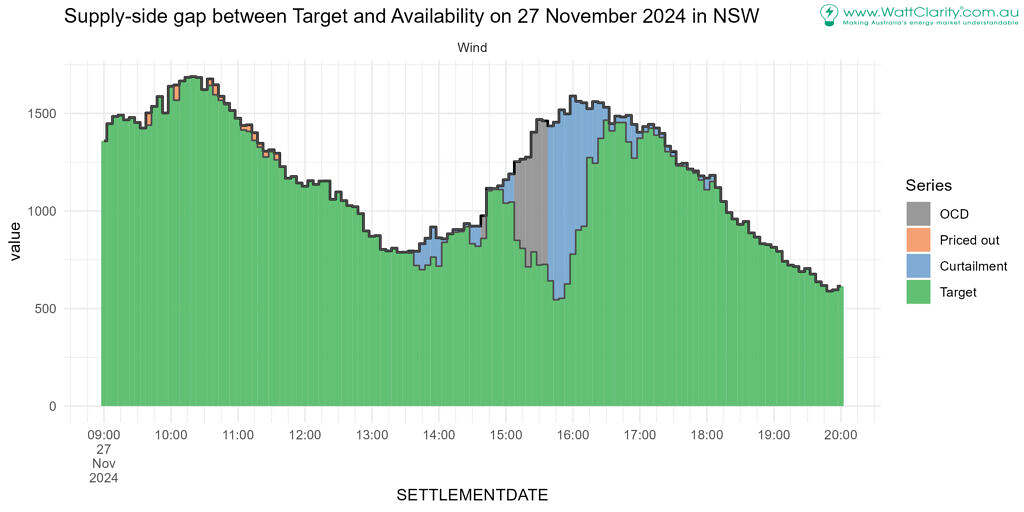
Solar units saw, predominately, curtailment when availability was not fully dispatched. 09:50 looks to be the only exception in the period we’ve assessed.
There was a reasonably high amount of variability in availability (relative to total availability) between one interval and the next (often around +/-200 MW). This is indicated by the top black line going up and down frequently. Its attributed to cloud formations suppressing solar irradiance over NSW during the day.
Wind
The low point for wind availability was in the early afternoon, around 13:00. Even them, some network curtailment is apparent.
Curtailment became considerable around 15:50 (possibly earlier, though we can’t say for sure given the OCD status of dispatch then). For example;
At 15:50 only 36% of available wind generation was dispatched.
By 16:30 curtailment had improved and continued at low levels into the evening.
Prices were relatively subdued in the morning (in the order of 50 – 200 $/MWh). We do observe some minor level of ‘priced out’ MWs in the morning. This is unusual for VRE unless the price is low.
For example, around 10:00 Flyers Creek Wind Farm had 30 – 50 MW occasionally priced at $17,500 during periods when the physical dispatching price was around $100 or below.
Gas
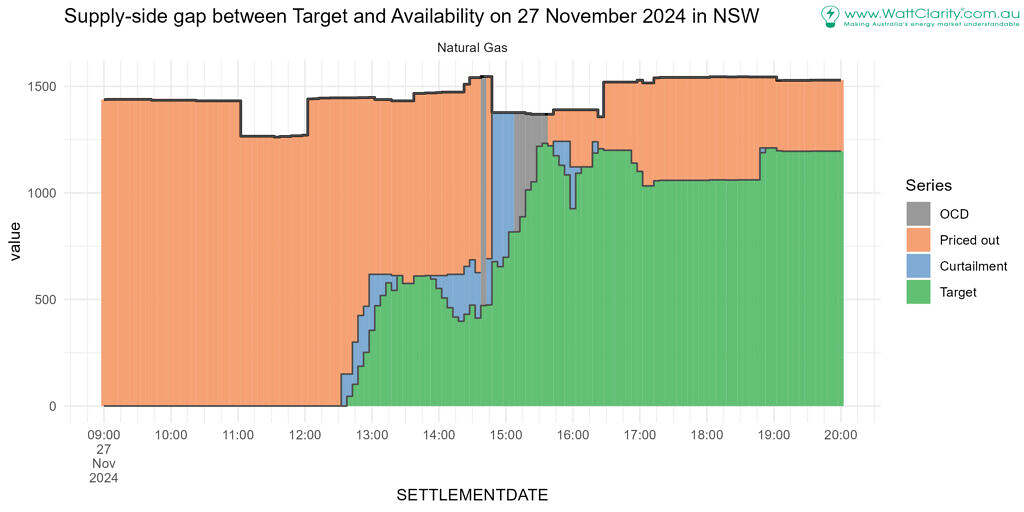
There was a key period of increased curtailment of natural gas from 14:50 to at least 15:05 (before OCD set in at 15:10).
Gas generators running at the time included Tallawarra B (A was on a planned outage) , Colongra and Uranquinty.
Battery Storage
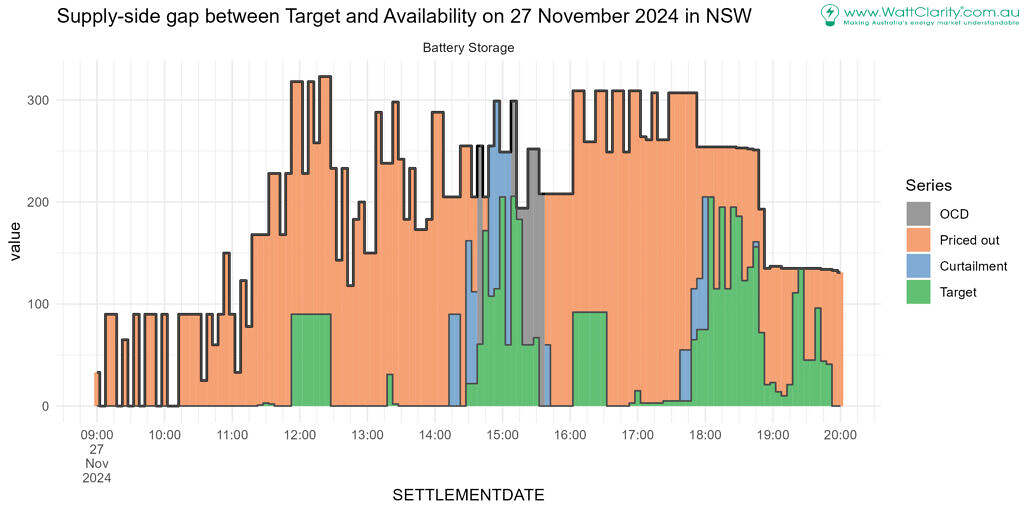
The same period of increased curtailment for gas units was seen for battery storage units.
On the batteries, for the purpose of this assessment, we’ve only aggregated them when they weren’t charging. One could take a different approach, but this approach acts to say that the unit was unavailable to supply because it was charging. This is the reason for the bumpiness in availability on the chart.
Diesel
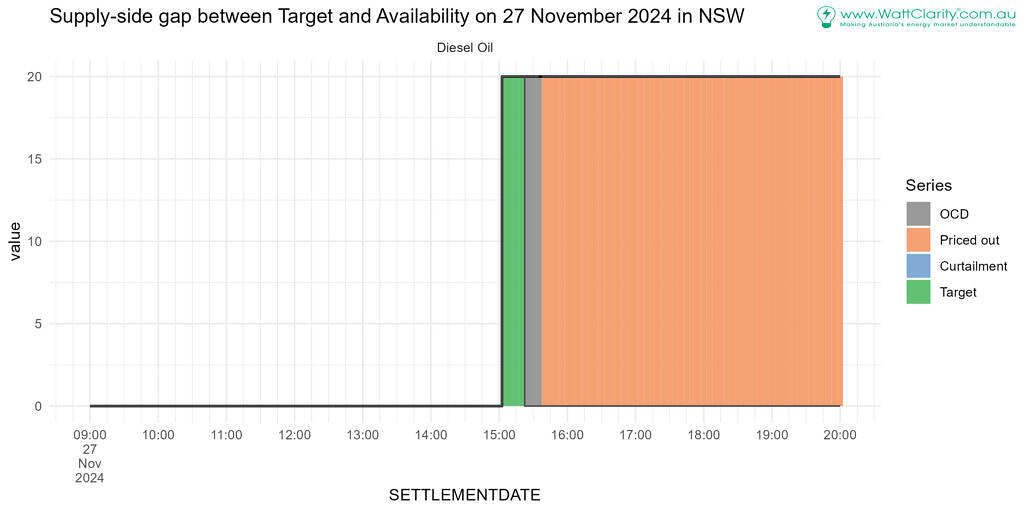
The diesel category saw full utilisation while prices were high, once it offered availability to the market. During the OCD period it was not dispatched from its availability of 20MW. Later, and still with availability, it was priced out.
Prices
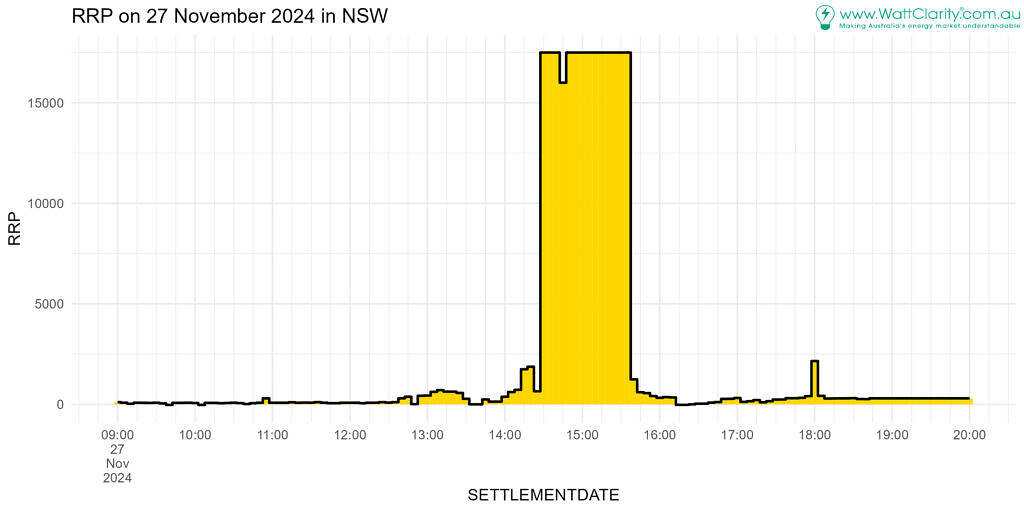
We’d mentioned prices a lot in the article. The split to distinguish curtailment for priced out uses the physical dispatching price, but units earn the RRP for the energy generated on the spot market (adjusted by their MLF). Here is the RRP (at the RRN) over the analysis period. This can be different, at times, from the physical dispatching price.
The details
More like caveats, perhaps, these points are worth noting:
- NSW supply units are included. Supply from interconnectors isn’t included.
- On the batteries, we’ve only aggregated them when they weren’t charging, as mentioned above in the Battery Storage section.
- When a unit gets a target that is below the level it’s bid suggests it should be, that amount gets tagged as is ‘Curtailment’. Generally this is network curtailment but it can also emerge due to plant limitations such as ramp-up limitations in thermal units. We noticed this occurring in the coal fleet from time to time on the 27th.
- We’ve not disentangled the role of FCAS co-optimization in how the energy target may be reduced/raised to provide headroom for FCAS in the charts. From time to time NEMDE will determine that the most cost-effective solution is to adjust a unit’s ordinary energy target so that it can enable it in an FCAS market (lower energy to deliver a raise service or vice-versa for lower services). For example, when energy targets are lowered below the volume offered at the dispatching price to support an FCAS raise service, that reduction amount in the energy market will show up as ‘Curtailment’ in the approach we’ve used. In any case, it’s not an economic choice being made by the generator. Rather its result of the dispatch engine meeting the requirements of the network – namely the enablement of the required amount of ancillary services. Explicit separation of this will have to be for another day!
- Wholesale demand response wasn’t included in the study even though these loads act as a supply-side resources in dispatch.
- Non-scheduled units aren’t included. These units aren’t managed in central dispatch so we can’t detect and attribute changes in output to the categories used in this article. Yet non-scheduled units may still be price-sensitive.


Nice work.
Thanks Peter!
The ‘priced out’ description works well.
I understand why inverters will be curtailed, but GFG? Curtailed implies it is priced in but can’t run due to network constraints.
Thanks Ben! And yes, gas fired gen was also curtailed. We see it more often for the solar and wind because there is generally more transmission network between them and the load center, so more flow pathways to be managed with network constraints. But all gens are connected to the network at some point so there’s potential for certain network conditions or settings to impact all types of gens, at times.