Monday 16th December 2024 was an interesting day in the NEM for a number of reasons:
1) Early on (in the week prior) there were forecasts of a sizeable amount of load shedding (i.e. forecast LOR3) …
(a) but they were managed by the deferral of a high-impact network outage that was a primary contributor
(b) even without those dire warnings, it remained of interest.
2) High temperatures across a large part of the NEM drove ‘Market Demand’ to its highest point in four years.
3) Those same high temperatures may have had some effects on capability of supply options (remembering that high temperatures affect pretty much all types of plant)
4) Coupled with this, there was widespread network congestion across western NSW and western VIC.
5) Even with those high temperatures, price outcomes were quite well behaved.
So we’ll use the ‘Bids & Offers’ widget in ez2view to do this quick initial review and then, depending what we see, determine whether we want to invest further time to delve deeper…
(A) Bids across the NEM
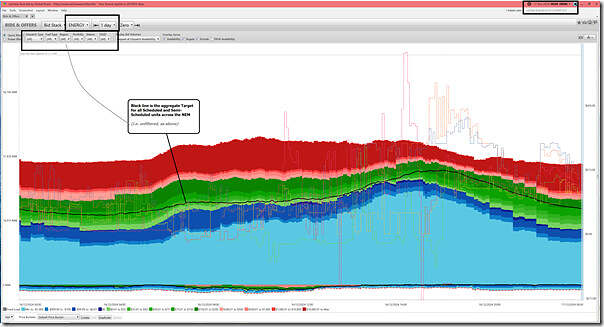
Time-travelling the ‘Bids & Offers’ widget in ez2view back to 00:00 (NEM time) this morning and looking back 24 hours, we see the trended concatenation of all ‘as seen for dispatch’ bids (i.e. taking into account all rebids up to each dispatch interval):
Some quick notes:
1) In this case the ‘Bids & Offers’ widget is showing ENERGY commodity
… we won’t be looking at any of the FCAS commodities in this article
2) It’s unfiltered
… so showing all Scheduled and Semi-Scheduled units
3) We see the bids aggregated into the ‘Default Price Buckets’ which use our commonly used blue, green and red price ranges.
… for longer term context, remember that we published this ‘Updated trend of ‘ENERGY’ bids in red, green and blue’ (looking back ~24 years) in April 2024.
4) Note that through all 288 dispatch intervals in the day, we see the black line (which represents aggregate Target for all units in the filter) coincides with volume in the green bands
… though shrewd eyes will recognise that some of the prices during this period were above $300/MWh (such as in this snapshot of 17:30), which would have been triggered by pink bids.
5) Remember that, since the Implementation of the IESS we show in ez2view all consumption parameters as negative quantities.
(a) That’s why there are negative quantities
(b) Keen eyes will also see that there’s a second black trend … this time with negative quantities, being
With the above background in mind, let’s peel another layer back and look at the two regions of particular interest…
(B) Bids in NSW
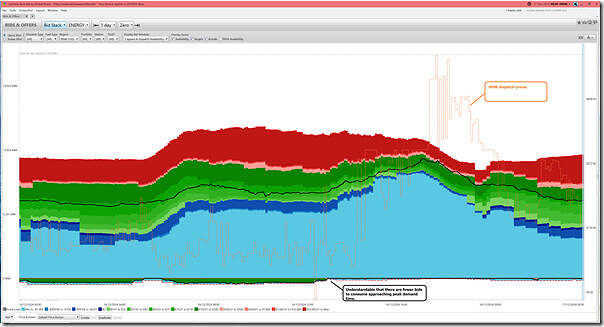
Filtering down to bids just for units in NSW, we see the following:
Nothing particular to add here.
(B) Bids in VIC
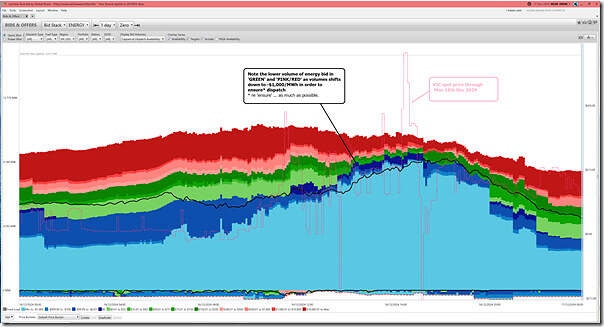
Here’s the same sort of view, filtered down to VIC units (and showing VIC spot price):
For Victoria, we’ll now peel back another layer of the onion, by filtering down to various fuel types …
(B1) VIC Firming Capacity
… starting with Firming Capacity (both old and new) …
(B1a) VIC Coal Capacity
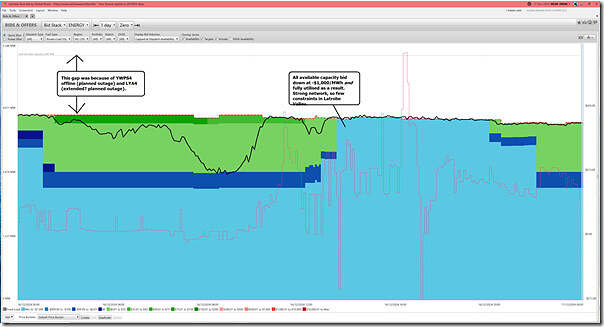
Here’s the coal units:
Eight of the ten brown coal units were fully utilised during the afternoon/evening period, especially because of their bids down at –$1,000/MWh at the RRN. The two units offline were:
1) Yallourn unit 4 … on its Major Planned Outage
… which is, I think, the last of 4 units to see this Major Planned Outage following the ‘let’s improve the performance’ directive following the poor performance during 2022.
2) The Loy Yang A2 unit has been offline since 28th November 2024 in a Planned Outage … but we see in ‘Forecast Convergence’ widget (image not shown here) that this outage was originally slated to be finished by 11th December 2024 (i.e. Wednesday last week) … so the outage has been extended for a few days.
(B1b) VIC Gas Capacity
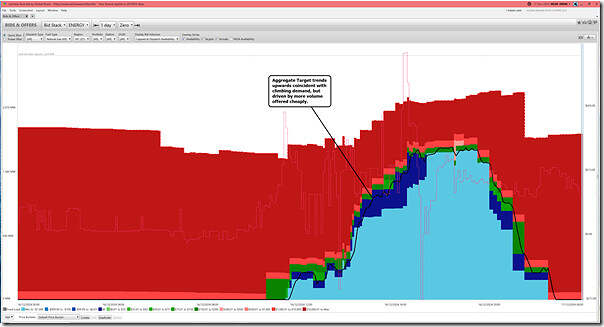
Flipping the filter to look at VIC gas-fired units:
We can see that Aggregate Scheduled Target (for Gas) trends upwards coincident with climbing demand, but driven by more volume offered cheaply.
Not illustrated here, but quickly filtering through the gas stations, we see that:
1) Bairnsdale was one station that remained completely undispatched, due to volume still offered above $1,000/MWh at the RRN
2) Jeerlang A had some dispatch, but most volume remained at the Market Price Cap.
3) Valley Point peaker also remained undispatched, with volume bid a few cents below the Market Price Cap.
(B1a) VIC Hydro Capacity
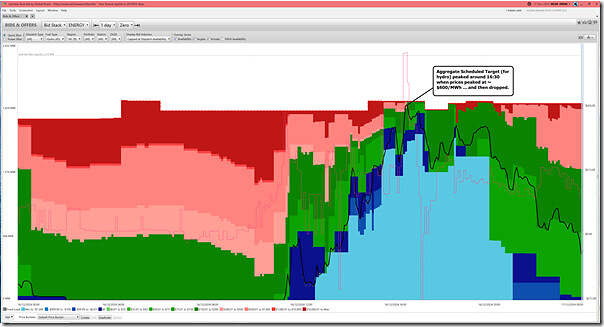
Aggregate bidding for Victorian hydro capacity shows some complexity, with a diverse range of bid bands used through the day (and even during peak demand times):
We see dispatch of hydro units peaked at almost 100% capacity factor during the dispatch intervals around 16:30 (NEM time) when the price was highest.
(B1d) VIC BESS Capacity
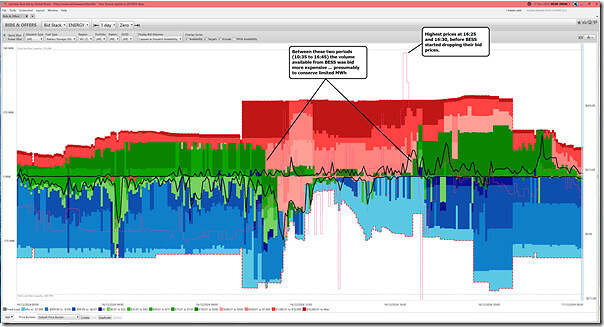
Remember that, since the Implementation of the IESS we show in ez2view all consumption parameters as negative quantities. That’s why this chart looks different than those above:
As noted, during the highest priced dispatch interval on the day (16:25 and 16:30), the vast majority of BESS capacity was bid above $300/MWh. A little after that point, volume was offered more cheaply. We presume that this was to conserve the very limited volume of stored energy.
(B2) VIC VRE Capacity
We’ll flip now to look at the two types of VRE (Variable Renewable Energy):
(B2a) VIC Wind Capacity
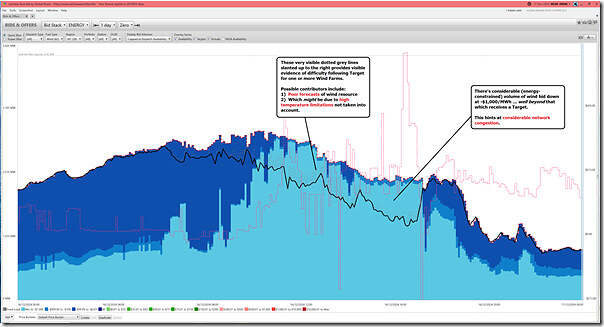
Let’s start with wind:
There are several things noted in this image that (time permitting) we’ll drill into further in a subsequent article. For this article well just note:
1) It seems highly likely that there was considerable network congestion affecting wind farms in western Victoria
(a) With a big clue being the large volume of additional energy bid down at –$1,000/MWh (i.e. light blue, above) that did not receive a Target
(b) Which is not a surprise, given what we saw and noted yesterday.
2) Additionally, it appears that (because of high temperature effects or other reasons) there were one or more Wind Farms that had considerable difficulty following their Target.
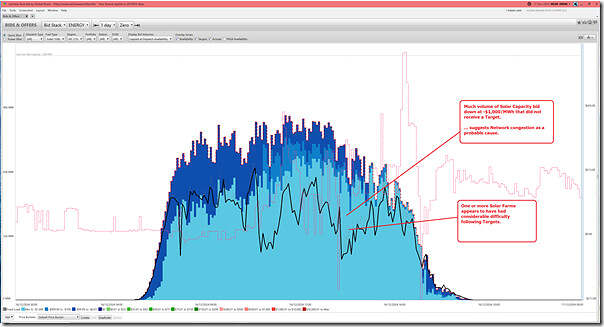
(B2b) VIC Large Solar Capacity
With Large Solar, we also see similar phenomena:
As with wind above, but perhaps separately (and if time permits) we might delve into both lines of questioning.


Leave a comment