Over the past seven years, standalone solar farms have faced a mounting list of challenges, leading to a natural but delayed shift in development focus towards battery co-location and the possibility of ‘hybrids’. Wind farm development is not immune to similar challenges, albeit to a different extent.
In light of recent changes brought about by the Integrating Energy Storage Systems (IESS) rule changes – and in particular the introduction of the new Integrated Resource Provider (IRP) category – we’ve had a couple of readers ask us about ‘hybrids’, and whether recent changes will address current issues.
In this article, I’ll summarise the challenges for standalone solar and wind over the long-term, and discuss how battery co-location and hybrids may, or may not, alleviate these issues. The challenges have been well covered in our annual GSD, our GenInsights reports, and through many case studies on our blog (see articles by Allan, Jonathan and Paul for a few examples) – here we’ll summarise these trends at the macro-level.
But first, what sort of hybrids are we talking about?
Some confusion still exists about what a ‘hybrid’ is, and it seems operators, developers, and others, are using the word interchangeably to cover many different types of projects. To try to make sense of the different permutations from an energy market/dispatch perspective, I’d recommend reading through the AEMO IESS documentation and beginning with this factsheet on IRP classification.
For the sake of this discussion, here I will simplify all of the configurations into two broad categories:
- Co-location. Multiple units (e.g. a solar farm and a battery) owned by the same entity, located together physically and may contain some common infrastructure – but are bid and dispatched independently. These units are in the format of either:
- Units registered as separate stations. Therefore the underlying units are treated entirely separately for dispatch and conformance.
- Units registered under one station. The underlying units operate in a slightly more collective manner – particularly if they have elected for the new Aggregate Dispatch Conformance (ADC) option, but more on that later.
- A single-unit IRP. One unit with multiple technologies behind it (e.g. a battery coupled to a solar farm behind the inverter with one Dispatchable Unit ID) – in this case, operations, bidding and dispatch are coupled.
To be clear, co-location has been around even before the IESS rule changes. Projects like Hornsdale Wind Farm & Hornsdale Power Reserve, Kennedy Energy Park, and Bulgana Green Power Hub serve as very different examples of co-location.
Single-unit IRPs on the other hand, have only become possible with the recent introduction of this new registration category, and we are yet to see any units register in this way.
The technologies behind these configurations can include a solar-wind combination (i.e. without a battery) but in this article I’ll only be referencing solar-battery and wind-battery combinations as these make up the majority of proposed projects.
Five challenges for standalone solar, and wind too
With that distinction in mind, let’s now walk through five key challenges facing standalone solar and wind farms in the NEM in order to frame discussion about whether co-location or single-unit IRPs address each. While this isn’t an exhaustive examination of all issues, it should summarise the major headwinds.
1) Softened spot price capture and economic curtailment
Undoubtedly the largest issue facing utility-scale solar farms has been the softening of daytime prices caused by the juggernaut of rooftop PV and the minimum stable loading requirements of coal generation.
In the next few charts, we will look at the long-term trend of Volume-Weighted Average Prices (VWAPs). In black is the VWAP for the region (weighted against total demand), and in grey is the VWAP aggregated for all solar units and all wind units. The wider the gap between black and grey, the wider the spread between average spot prices and the average prices dispatched for solar and wind farms.
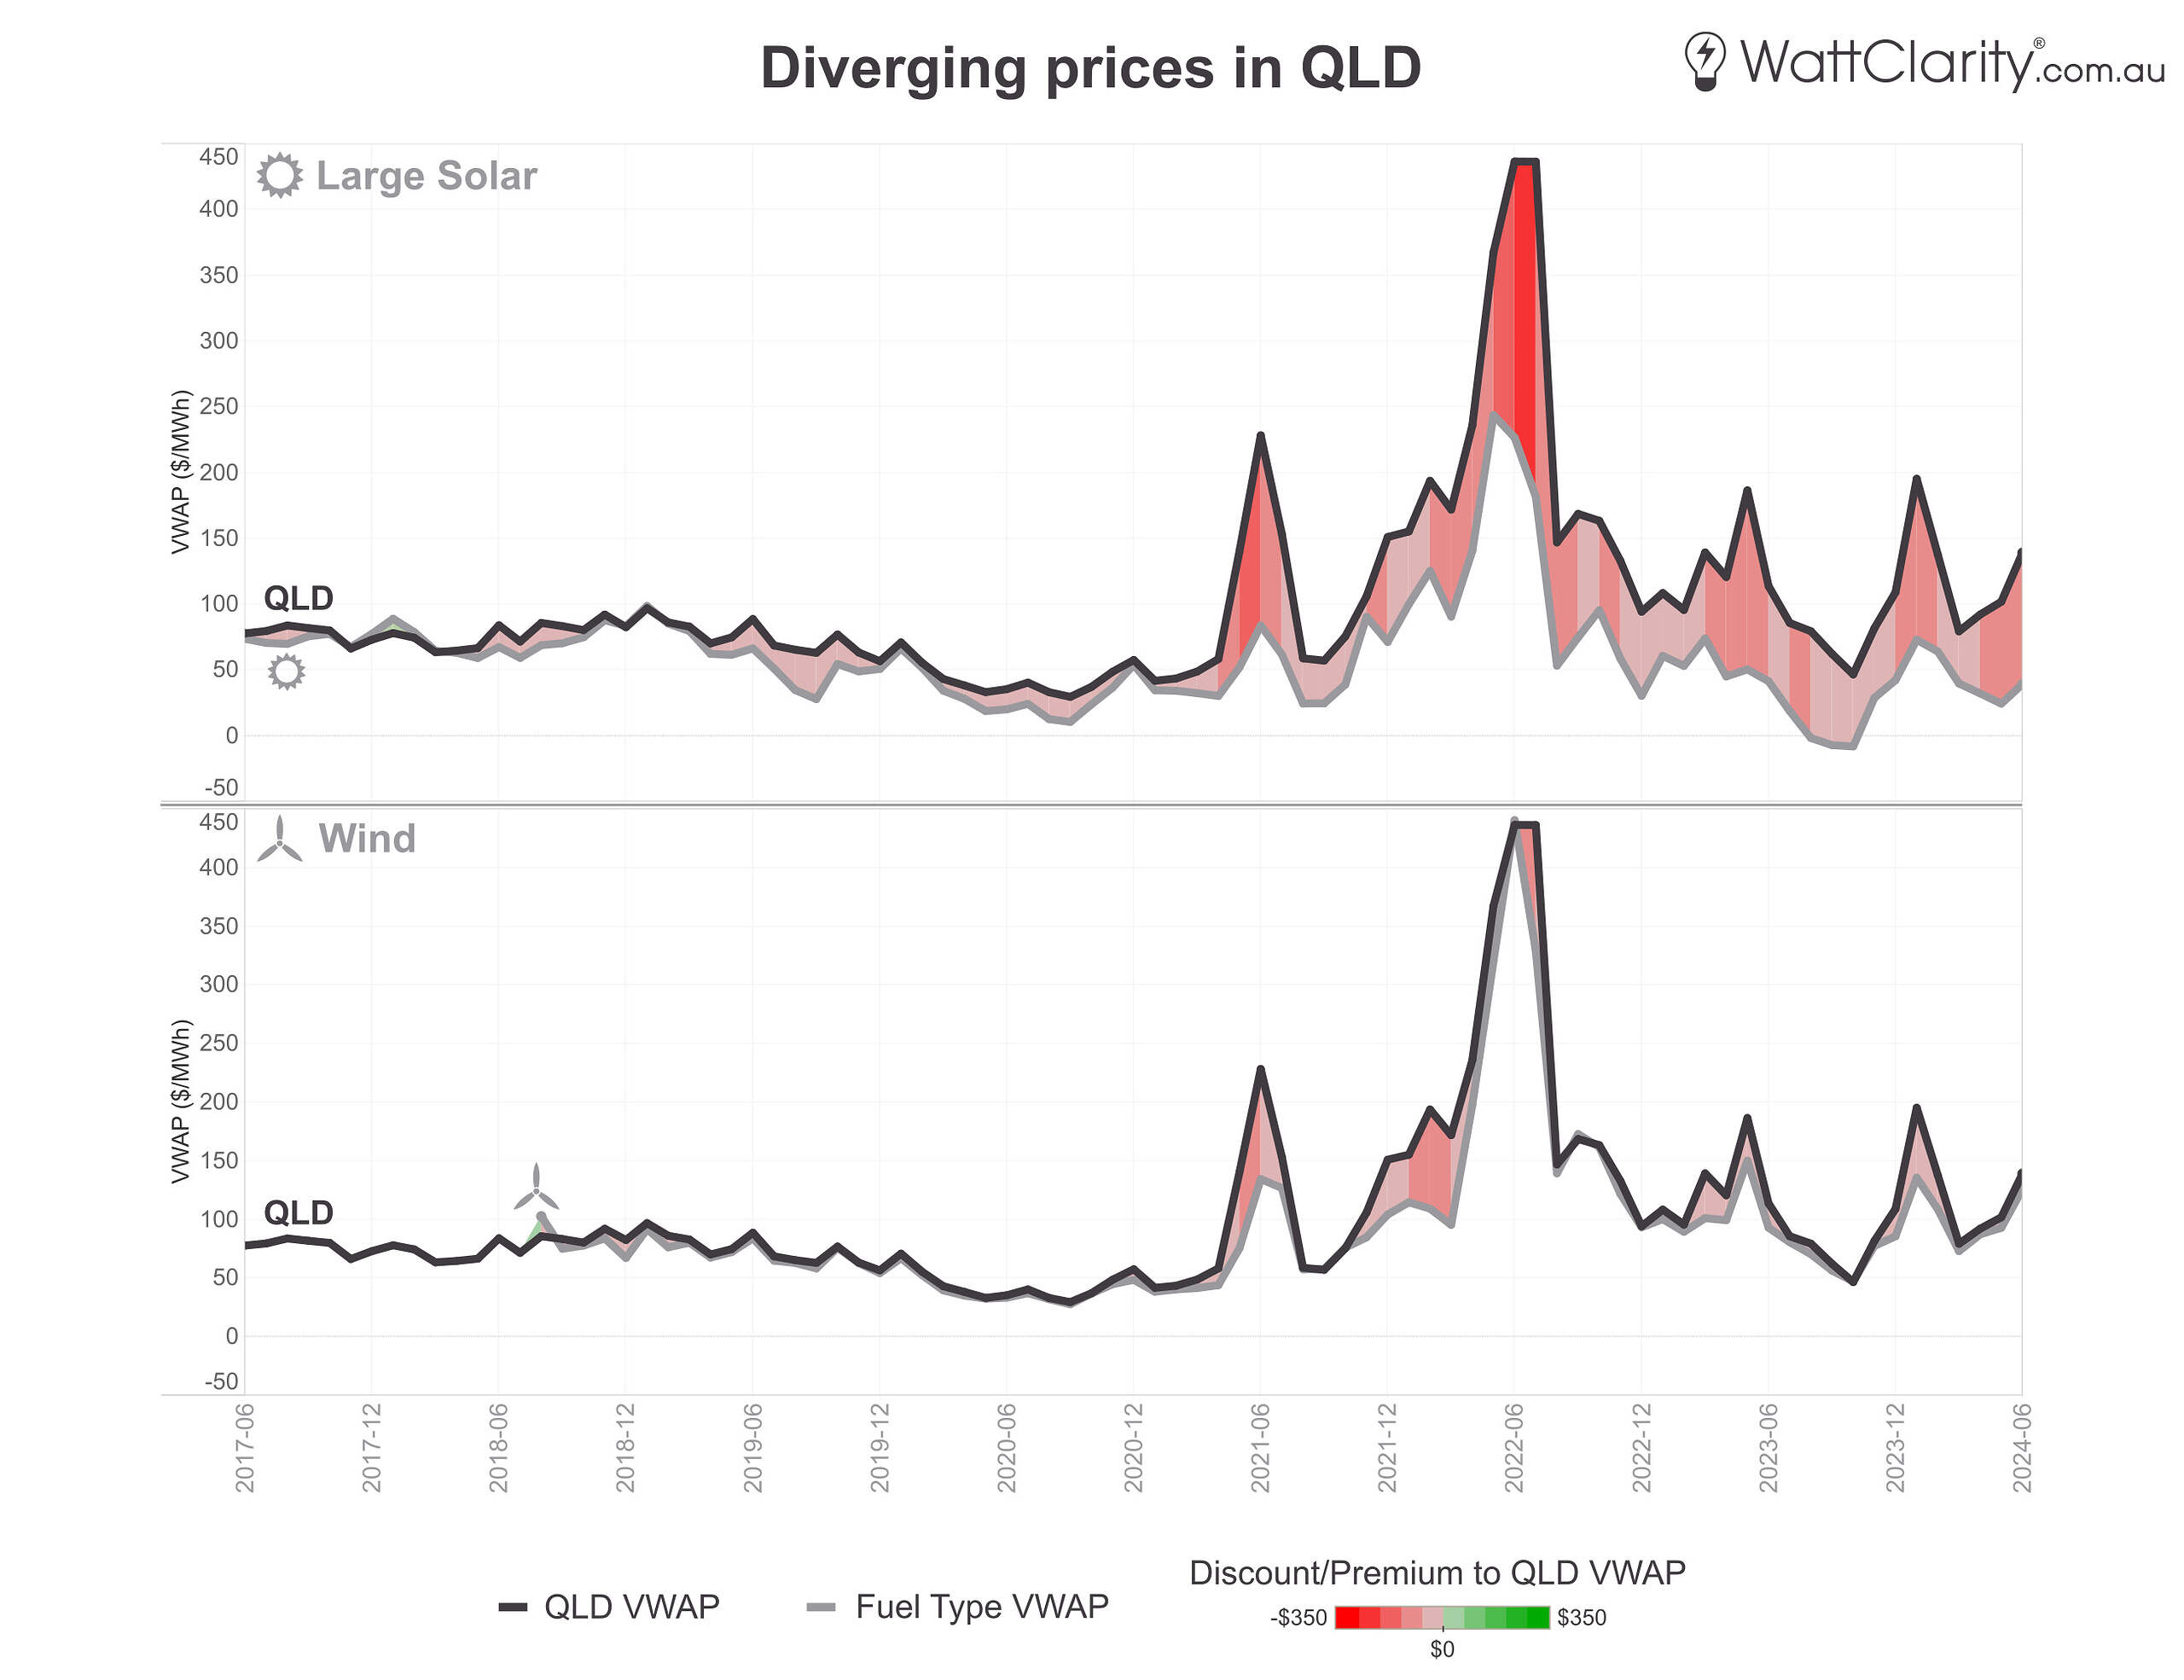
The gap between QLD’s VWAP and QLD Large Solar’s VWAP has been widening.
Source: GSD
Note: Only semi-scheduled units greater than 30MW maximum capacity included in solar and wind VWAP aggregation.
In northern regions – like QLD shown above – there is higher production from all forms of solar including rooftop, so we see knock-on effects of the ‘solar correlation penalty’. With a relatively small share of wind capacity, the VWAP for wind in QLD does not diverge nearly as much.
In southern regions – like SA shown below – where there is higher absolute production of wind (and almost all of it correlated to a mutual weather system) – the difference between solar and wind VWAPs are not as distinct. Also relevant to both trends in SA, is that the region is on the southern side of constraint issues along VNI.
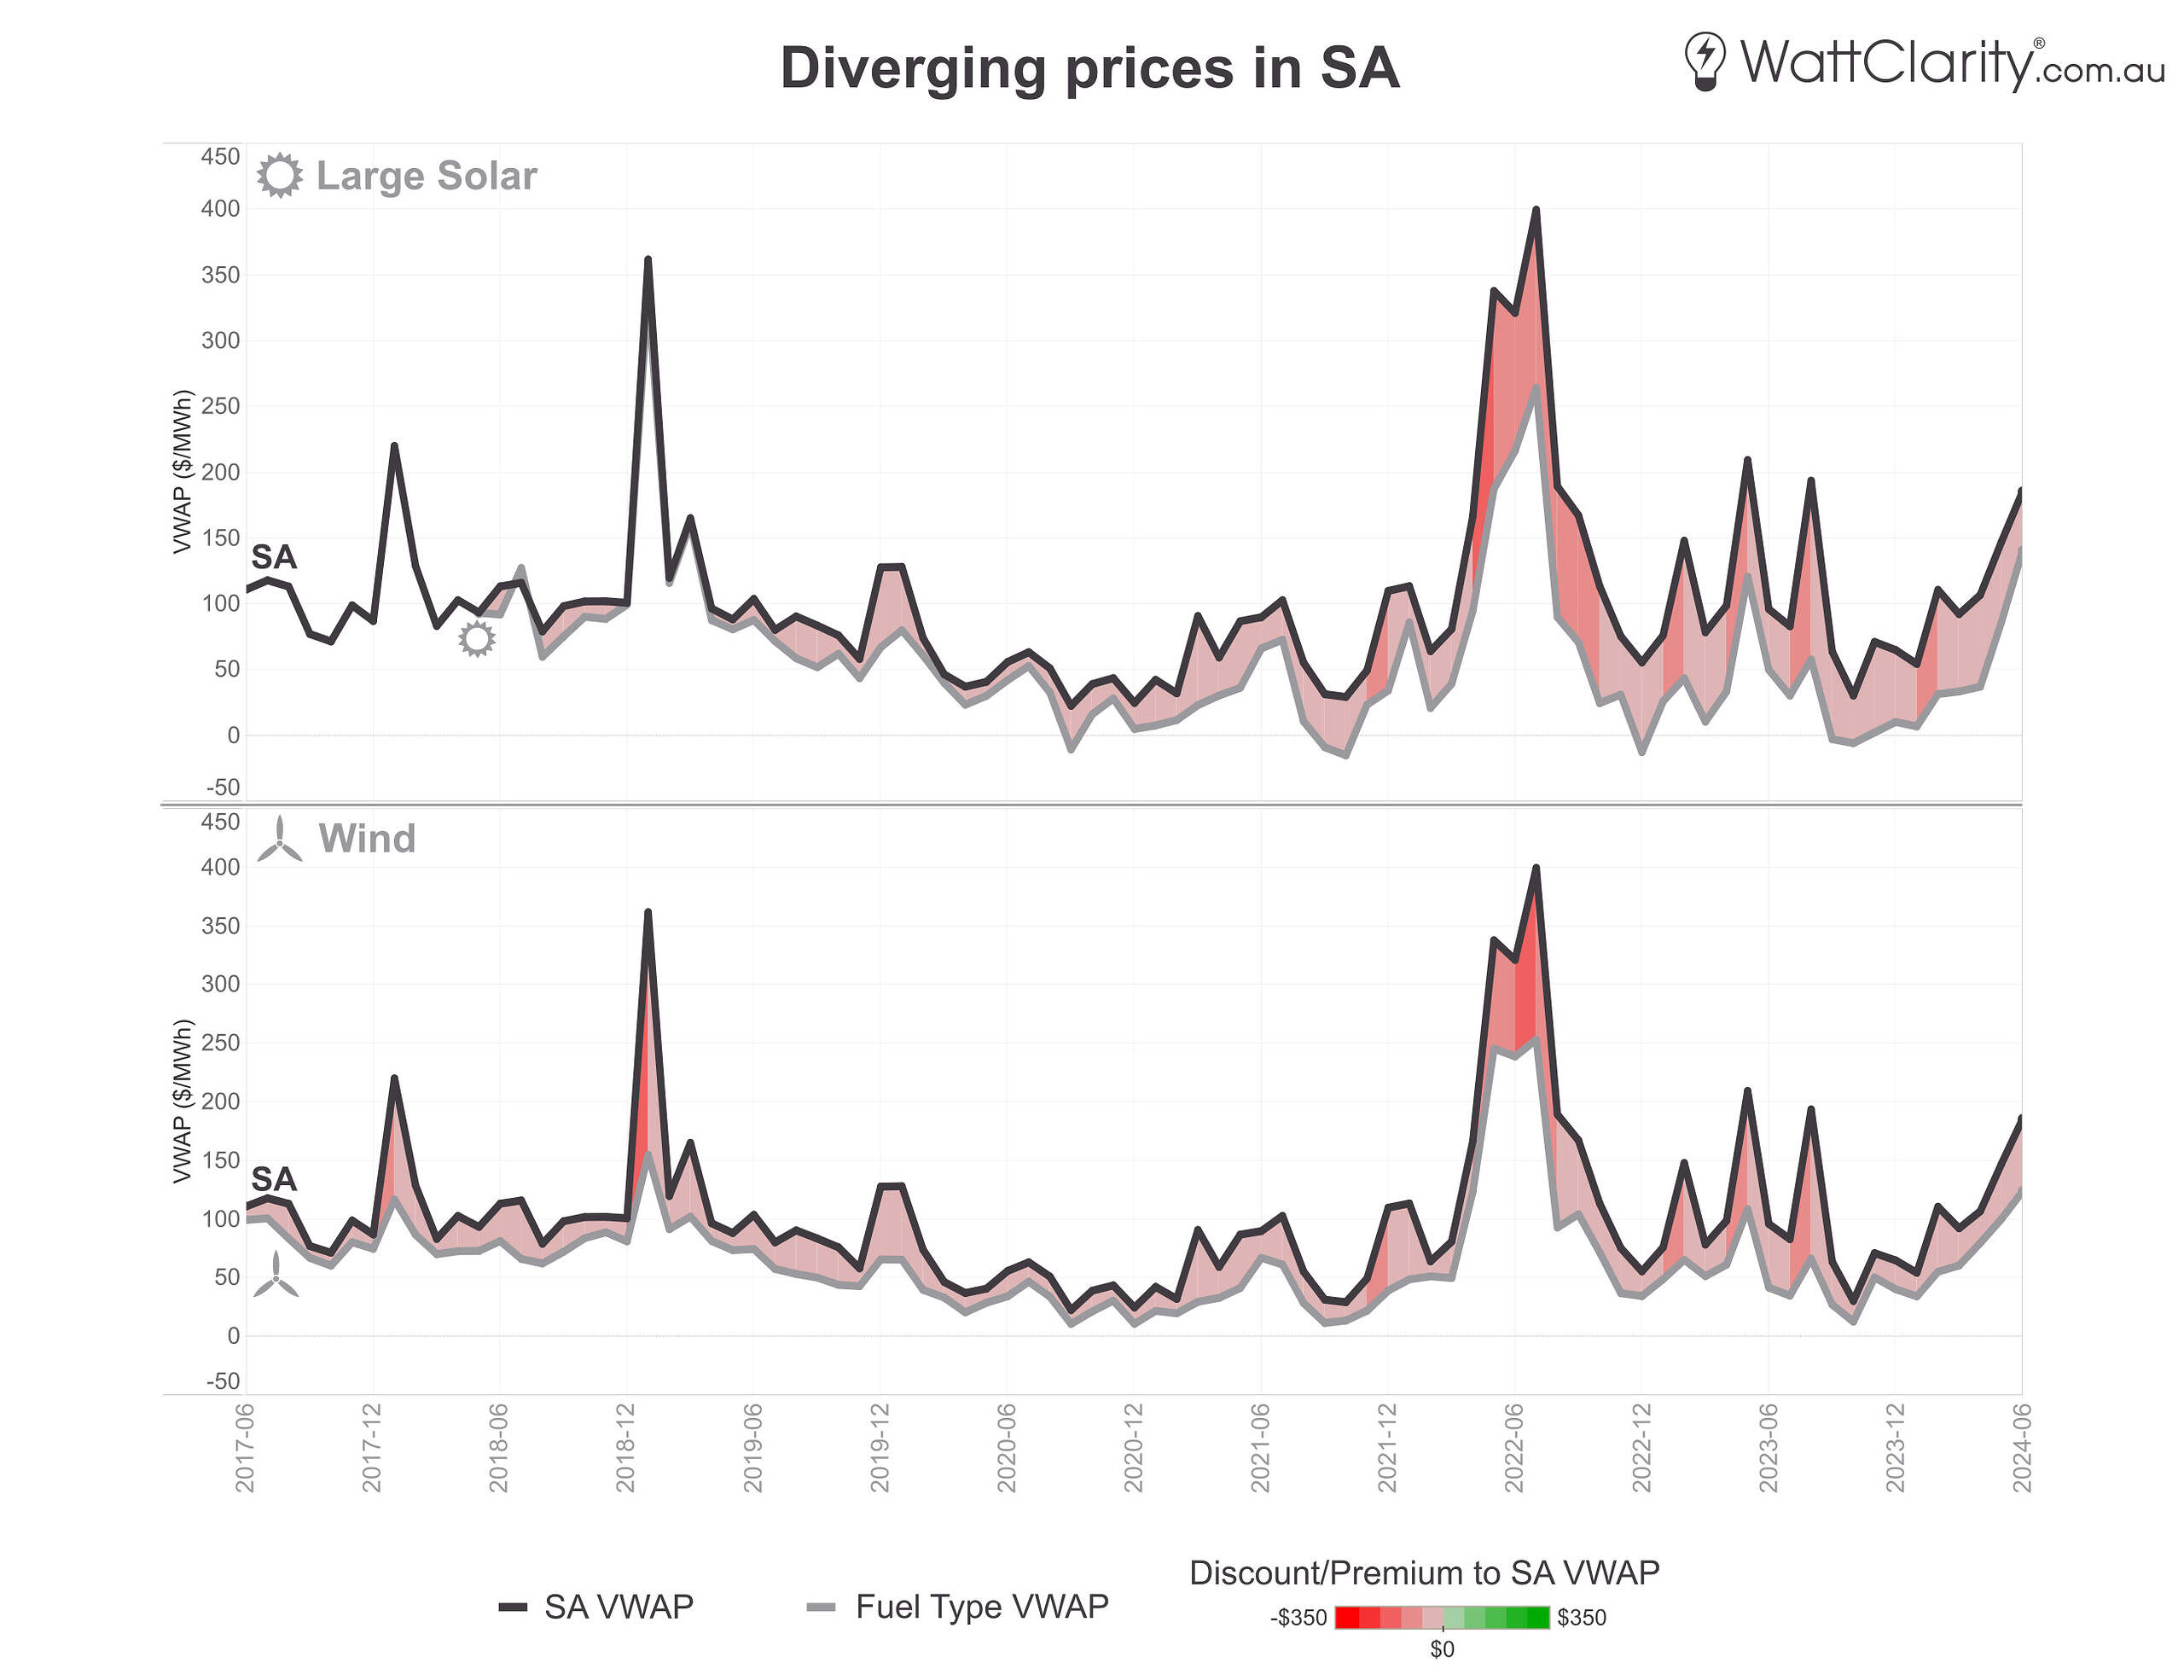
VWAPs in SA for Large Solar and Wind.
Source: GSD
Note: Only semi-scheduled units greater than 30MW maximum capacity included in solar and wind VWAP aggregation
Apart from looking at VWAPs, another pronounced trend is the number of MWhs being economically curtailed (or ‘offloaded’) by both solar and wind. The long-term trend is shown in the next chart, but I’ve also recently written this article about curtailment which digs slightly deeper into the where, how, and when, of this curtailment.
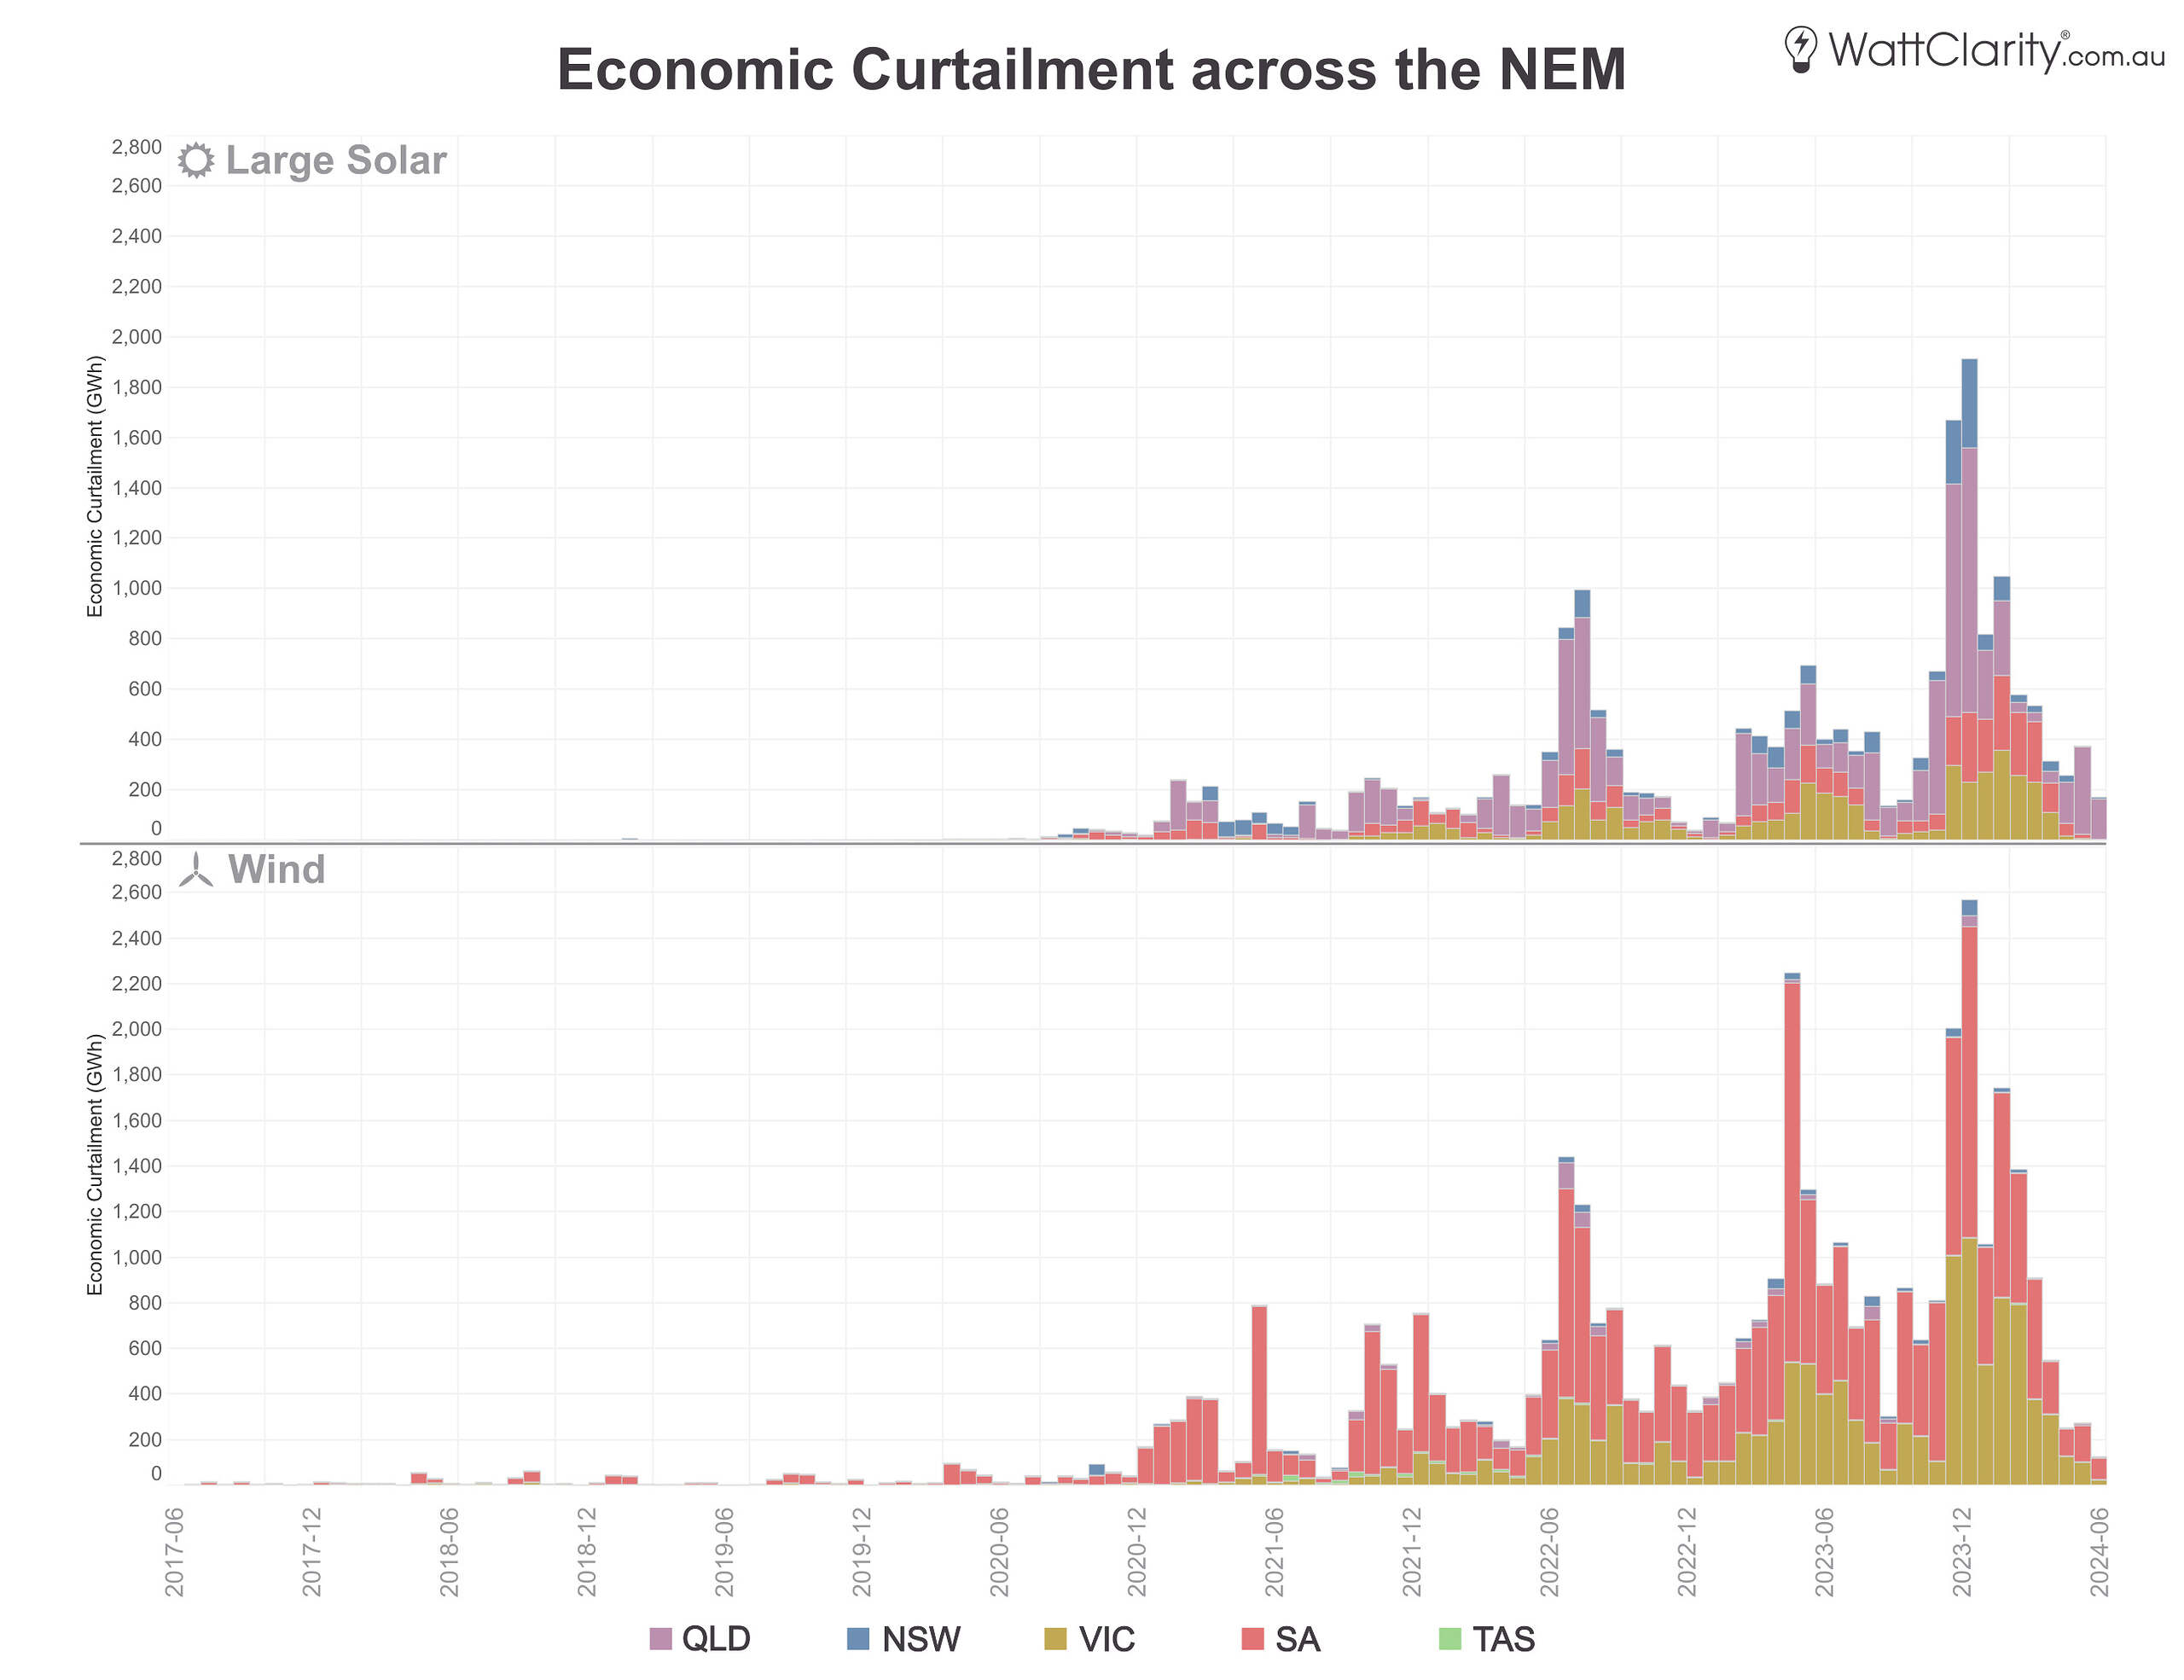
Economic curtailment (a.k.a offloading) has been increasing for both solar and wind.
Source: GSD
2) Falling Marginal Loss Factors
Marginal Loss Factors (MLFs) are the NEM’s market signal to account for electrical losses – and they can have a significant impact on top-line revenue for generation owners. In our GenInsights publications, we’ve kept tabs on how MLFs are trending at a sub-regional level, but the two charts below show a simple distribution for the full solar and wind fleet year-on-year.
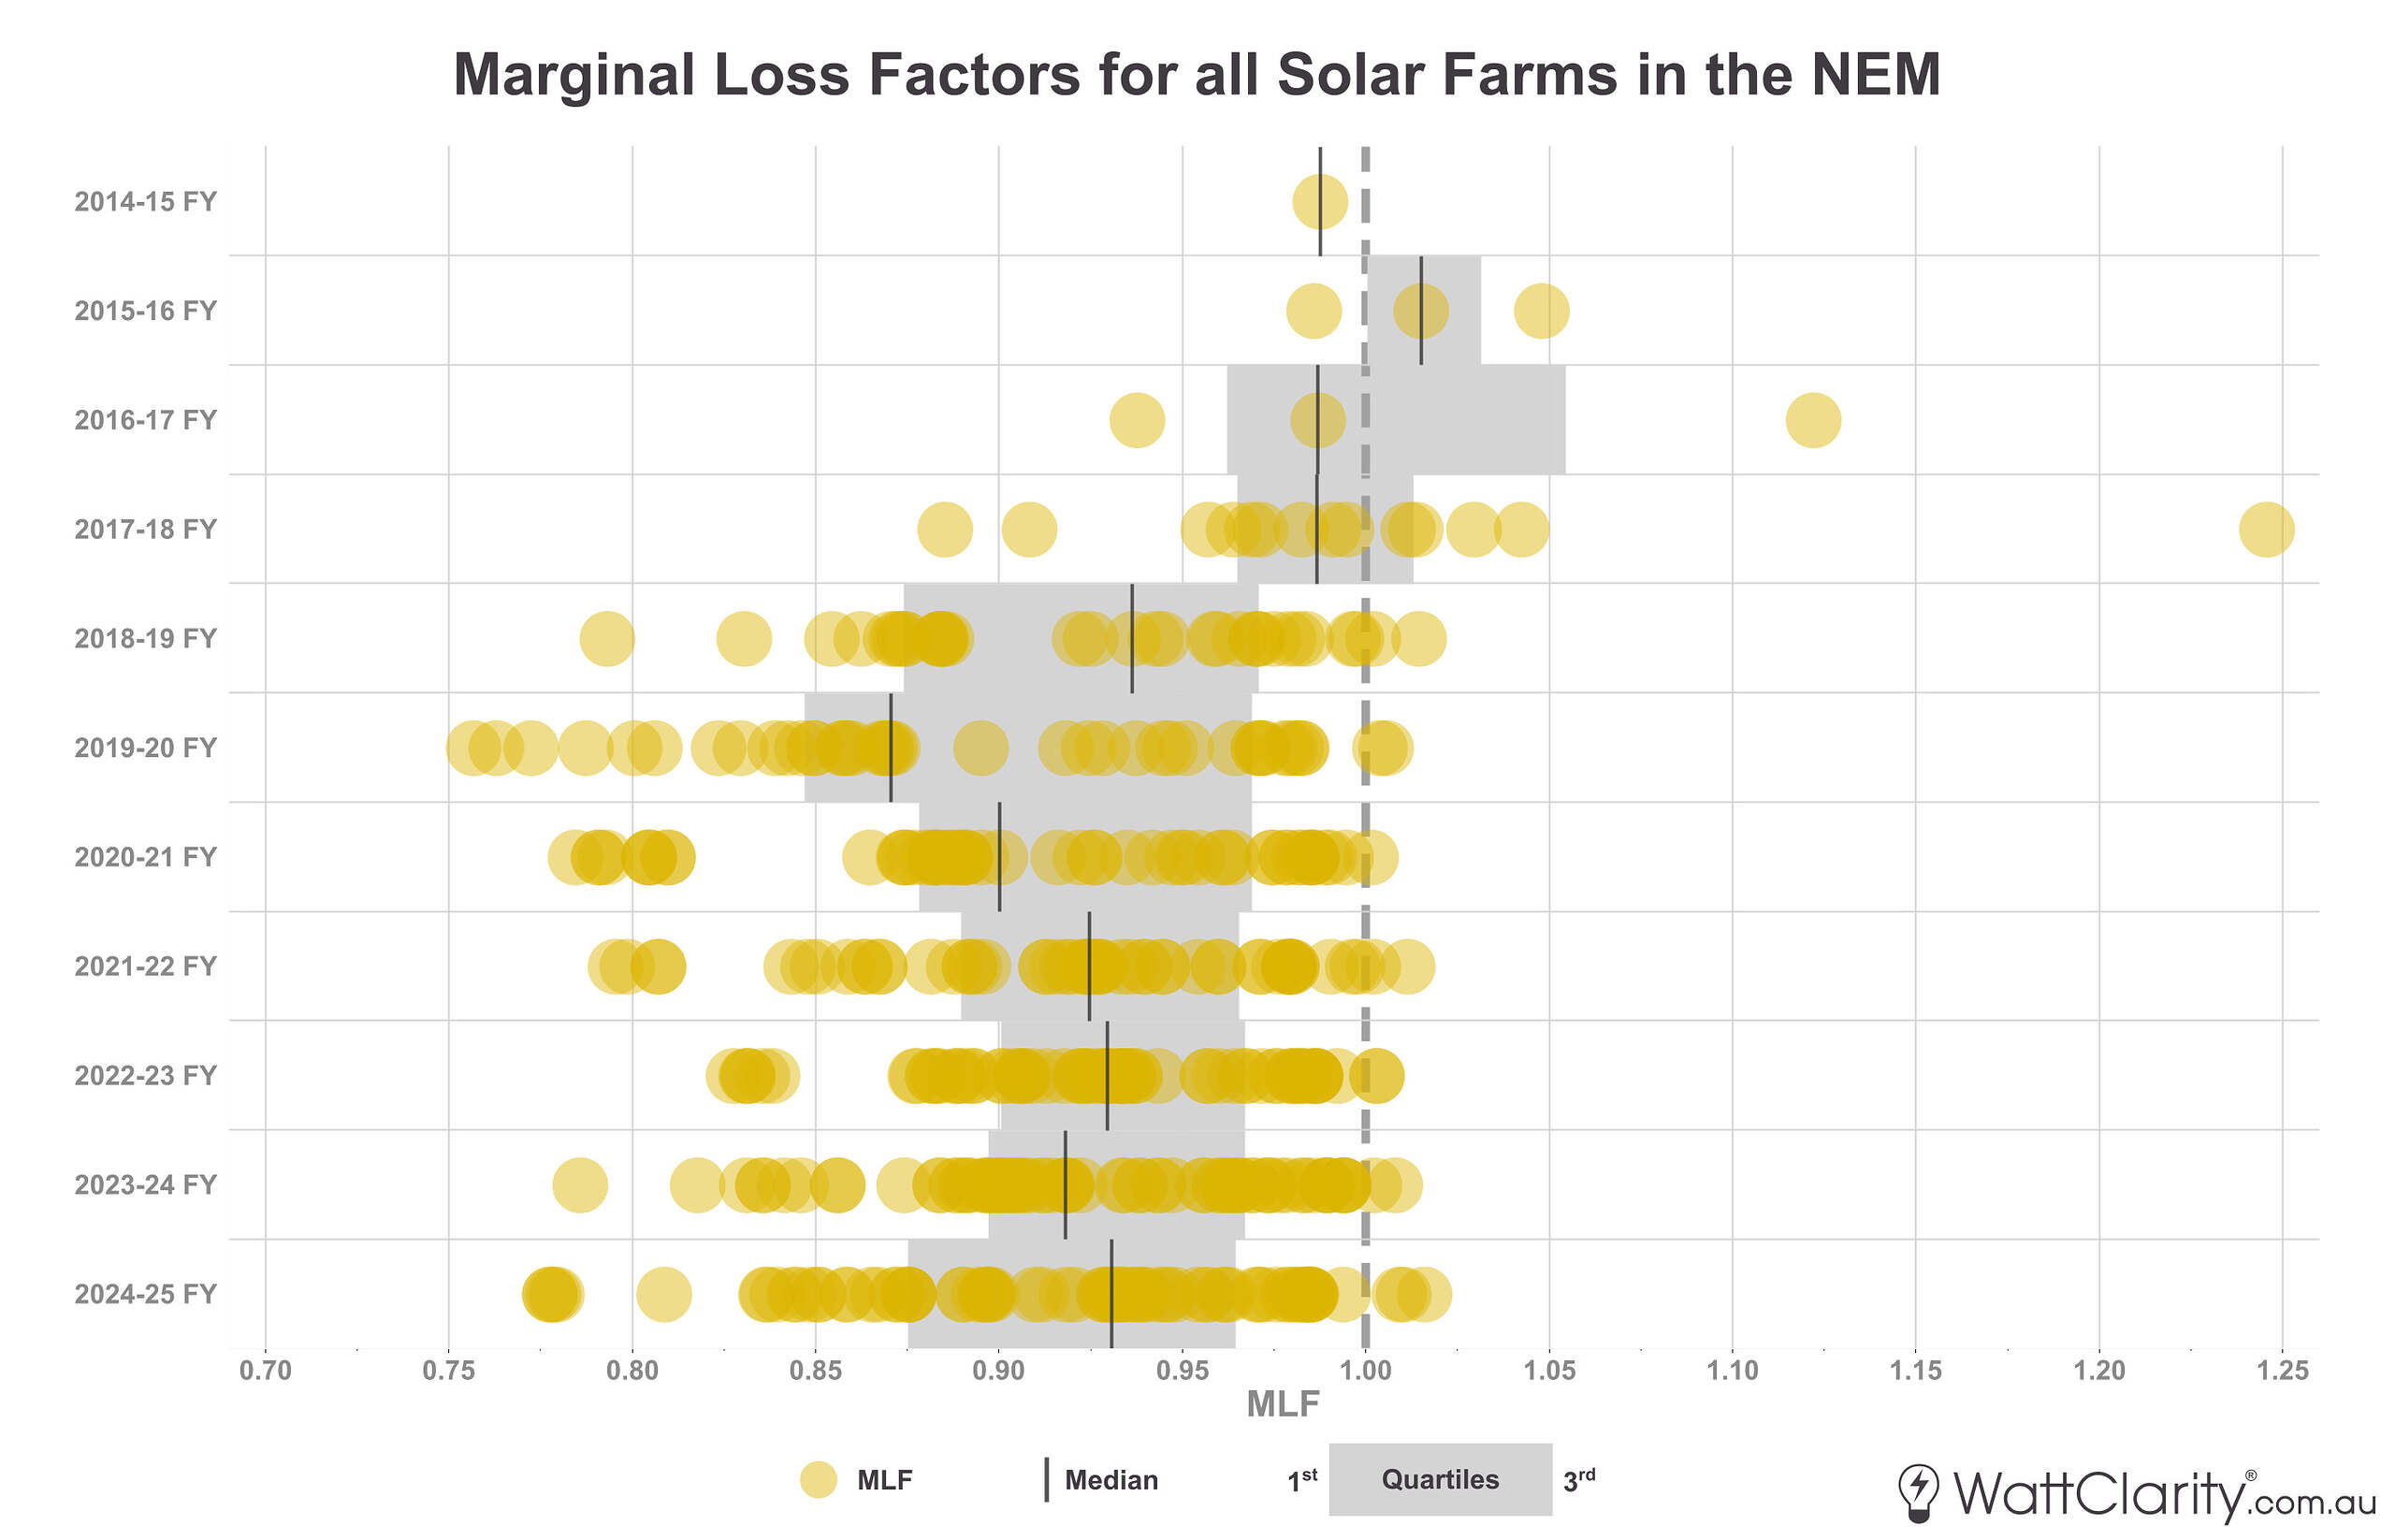
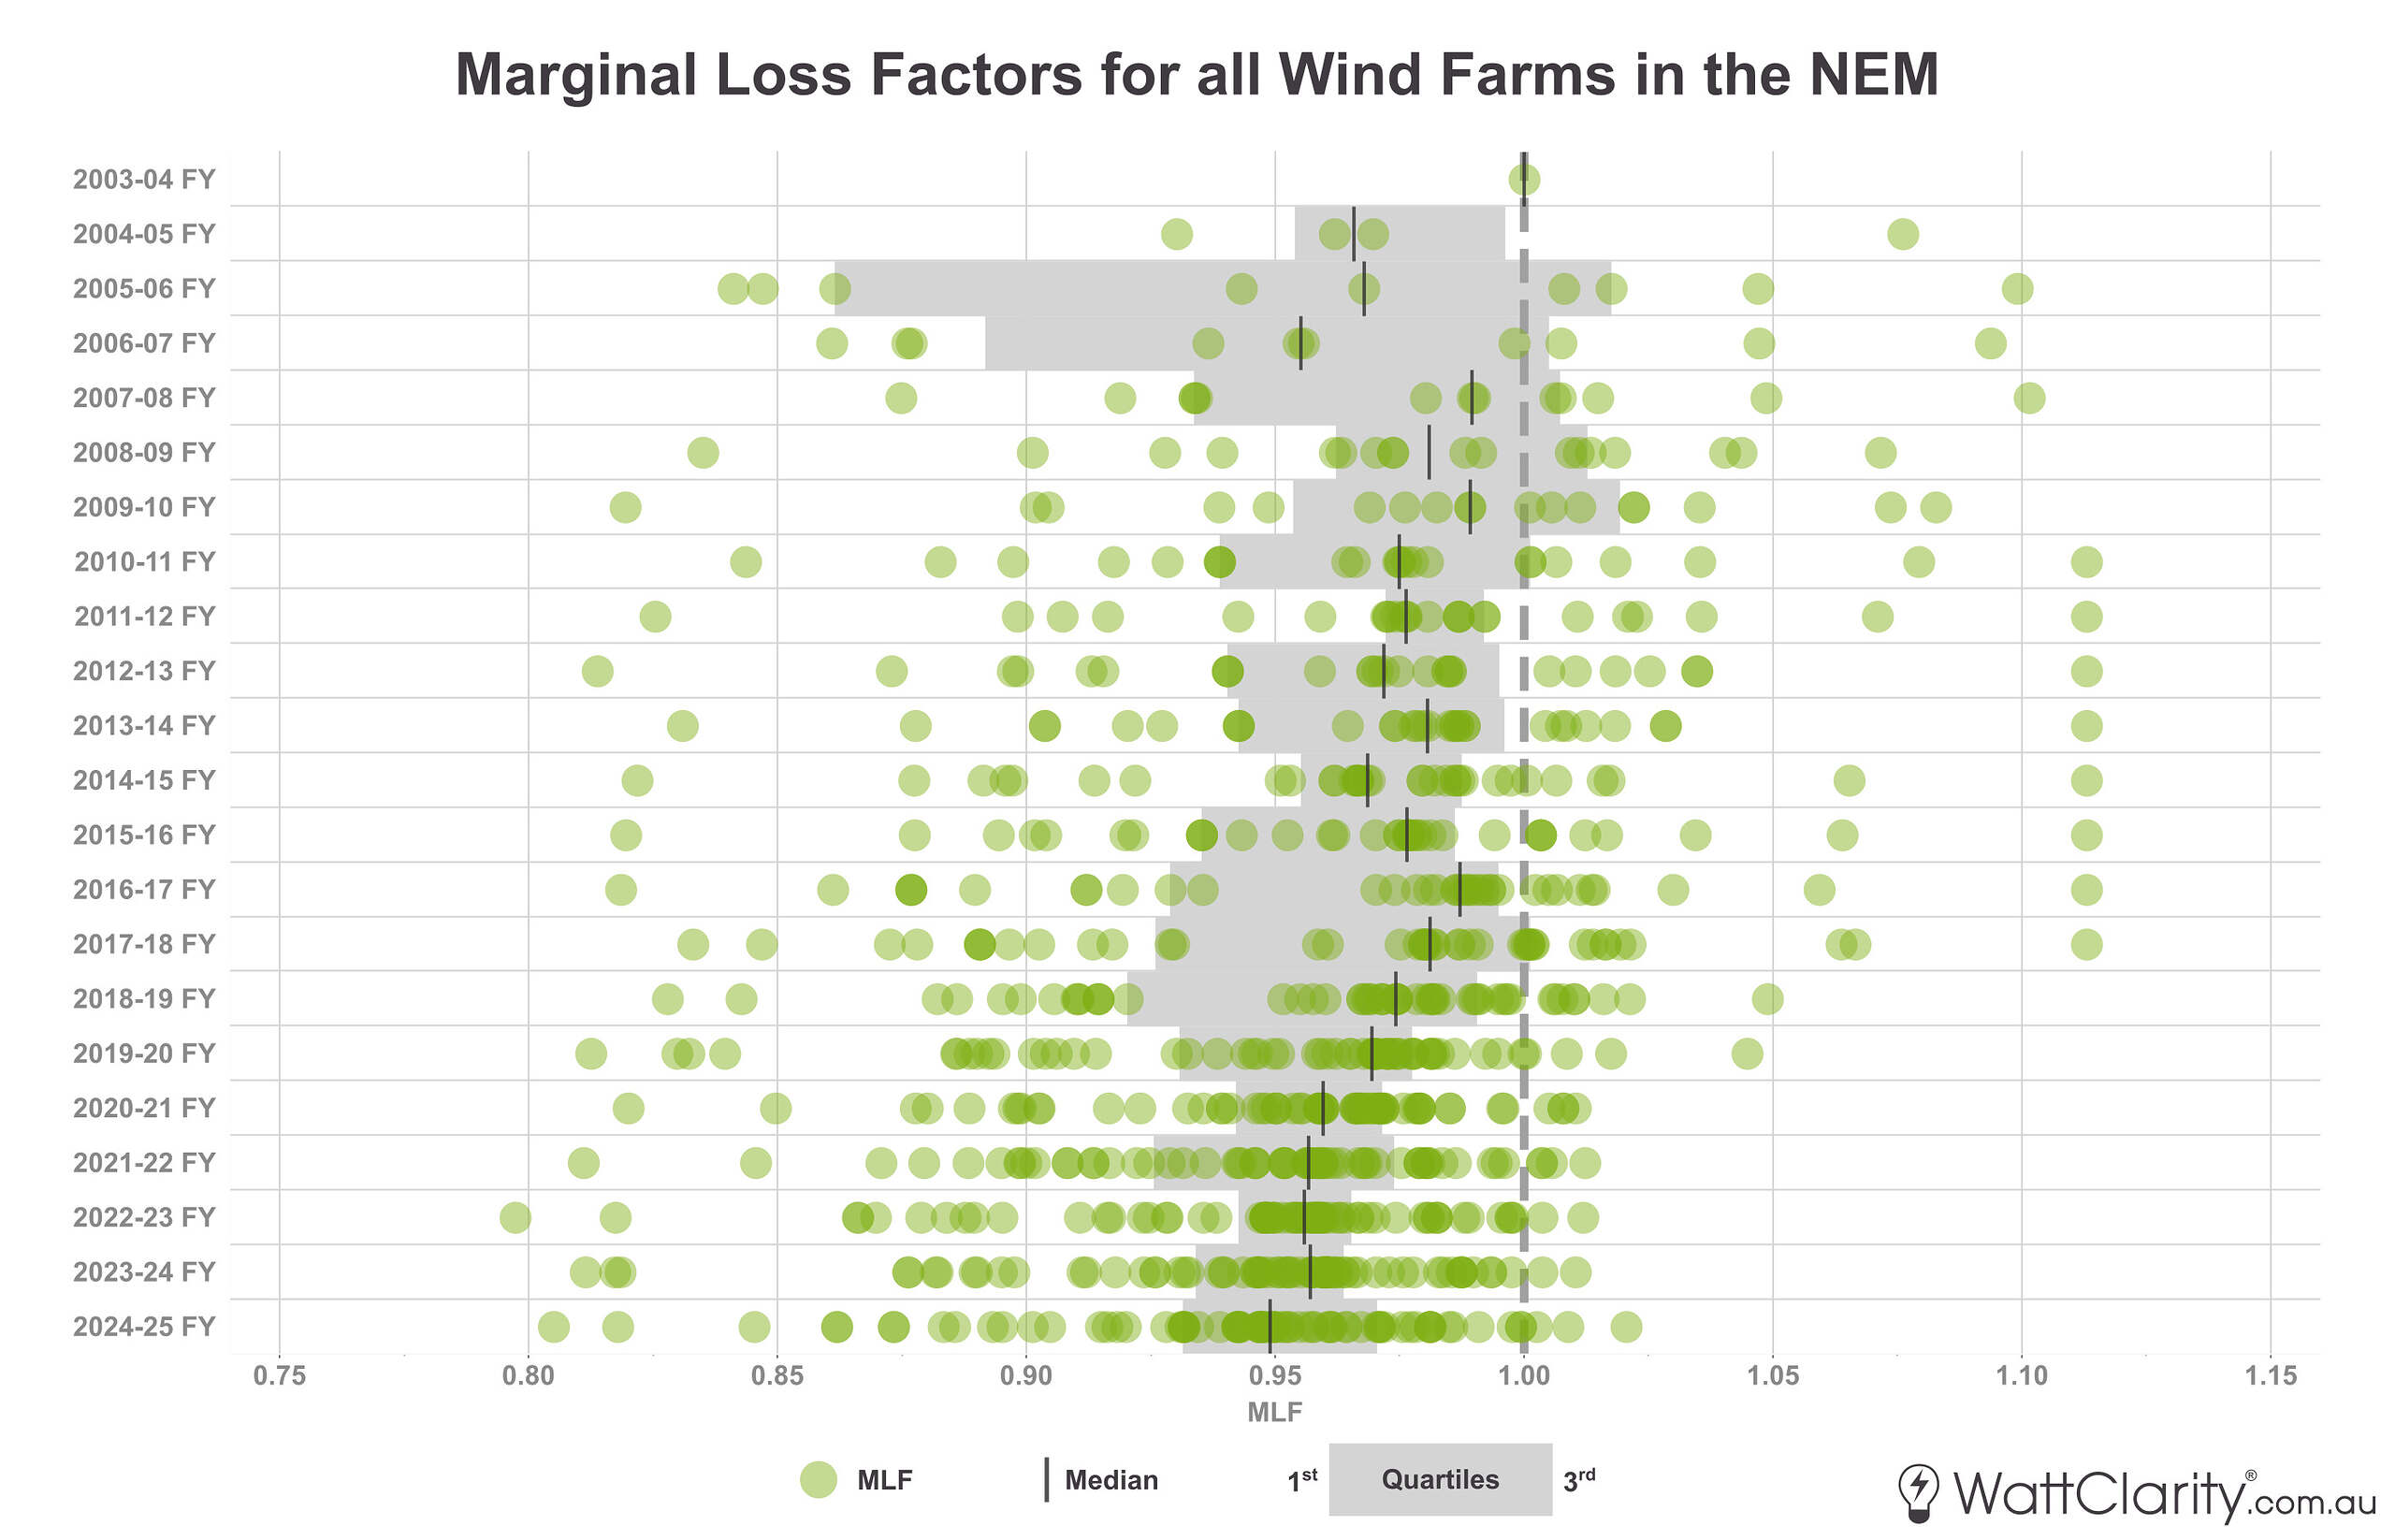
Long-term annual distribution of Solar and Wind MLFs.
Source: AEMO
Note: Only units greater than 30MW maximum capacity are shown.
The first chart highlights the two consecutive drops in MLFs for solar farms in 2018/19 and in 2019/20. In contrast, MLFs for wind farms have shown signs of general deterioration, albeit at a slower rate.
MLFs are calculated through a load flow model and represent the volume-weighted average of projected losses to/from a connection point for the financial year ahead. For these reasons, there is both a locational element, and a time-of-operations element in their formation.
3) Rising network curtailment
Network curtailment occurs when a network constraint limits a unit’s output to levels lower than what was available to generate. This type of curtailment has also been on the rise, affecting wind farms and now increasingly solar farms. The chart below shows the trend of these volumes over the past seven years.
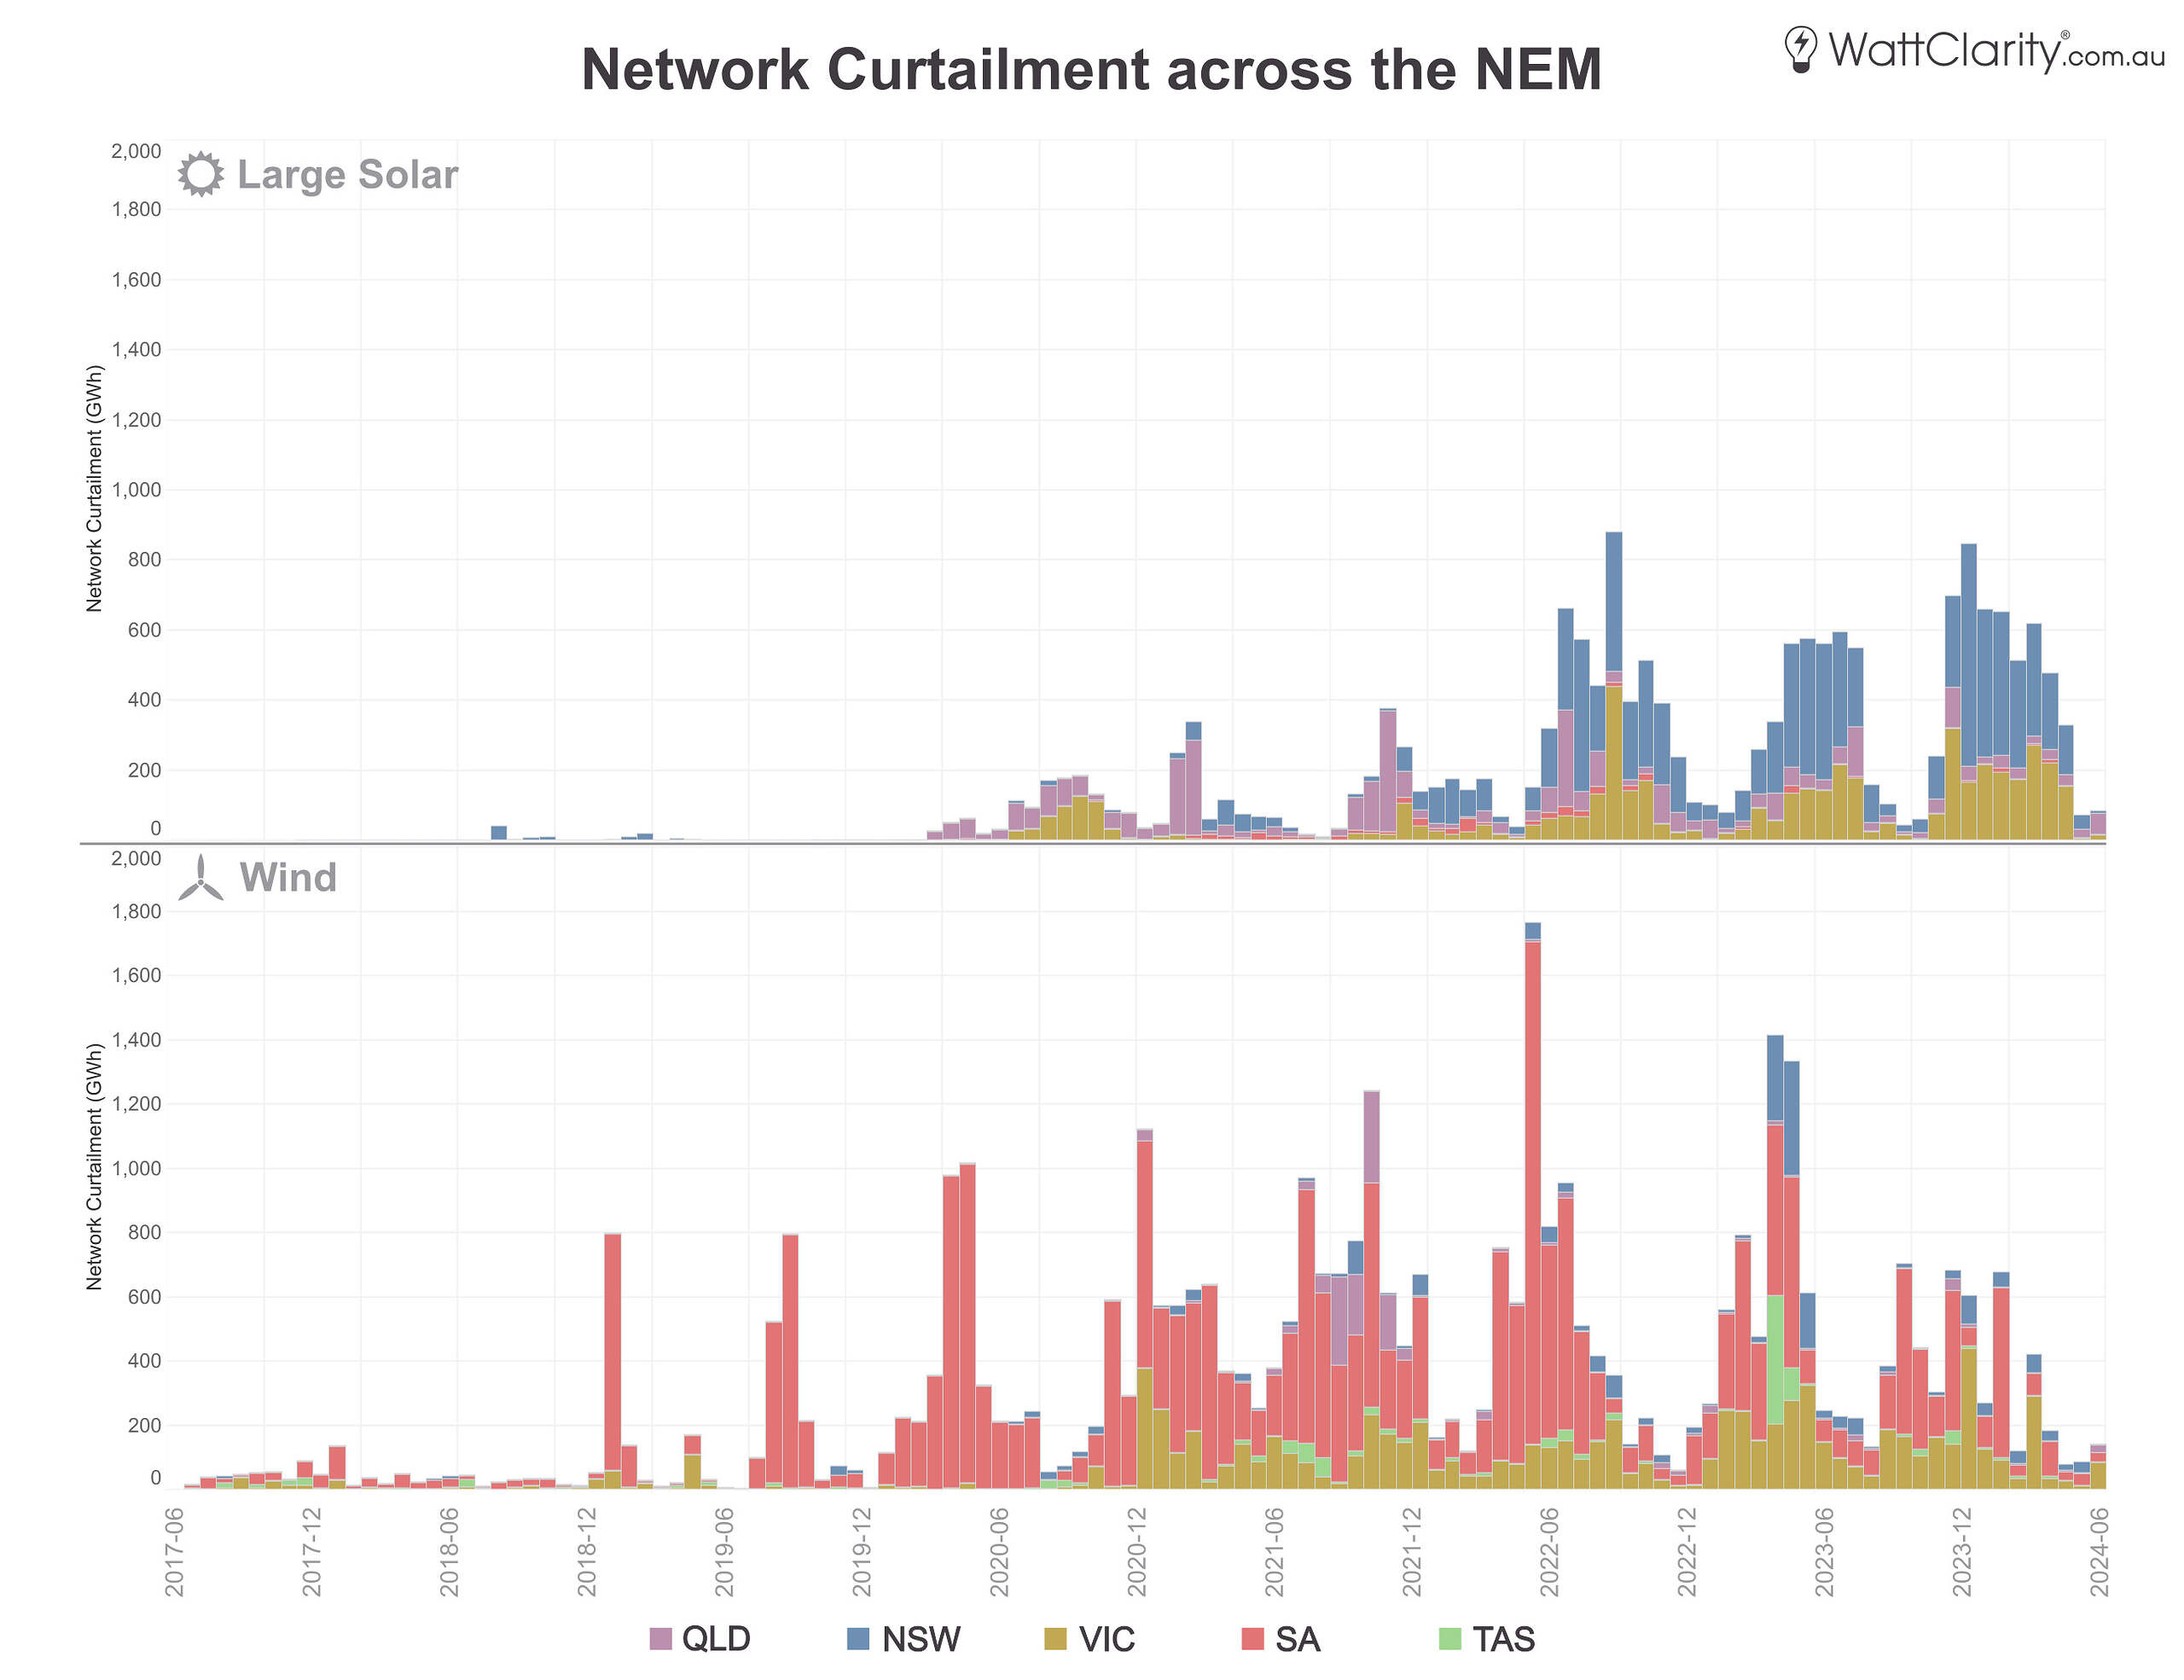
Economic curtailment (a.k.a offloading) has been increasing for both solar and wind.
Source: GSD
4) Rising FCAS costs
Generators pay a share of Regulation FCAS costs through the causer pays mechanism (although this scheme is due to be replaced in 2025), and a share of Contingency Raise Costs. Read Jonathon Dyson’s article here to understand more about these mechanisms.
For our presentation to the CEC earlier in the year, Linton Corbet analysed Regulation FCAS costs for wind and solar units in 2023 – where he noted that larger solar and wind units bore greater regulation costs.
5) A subdued lending market for standalone projects
These financial performance headwinds have also contributed to a reluctance from banks to finance greenfield standalone solar/wind projects. This, combined with the fact that project scale is increasing (particularly for wind projects), has led to lenders preferring portfolio financing to diversify credit risk. This was recently well articulated by Nick Cowling from Macquarie:
“The average onshore wind farm in Australia now costs between $A3 million and $A3.5 million per megawatt to develop. That means constructing a 400-megawatt wind farm can cost upwards of $A1.2 billion, putting a strain on developers’ balance sheets and testing lender market capacity for single asset financings.”
Only a very small portion of existing VRE is co-located with batteries. As of my last review of the ‘scheduled’ big battery fleet back in March, only 7 of these were co-located with/near mutually owned solar farms, 3 with wind farms and the other 10 batteries were more-or-less standalone.
The next chart was created using the AEMO’s generator information spreadsheet and shows how this trend has begun to flip further down the development pipeline.
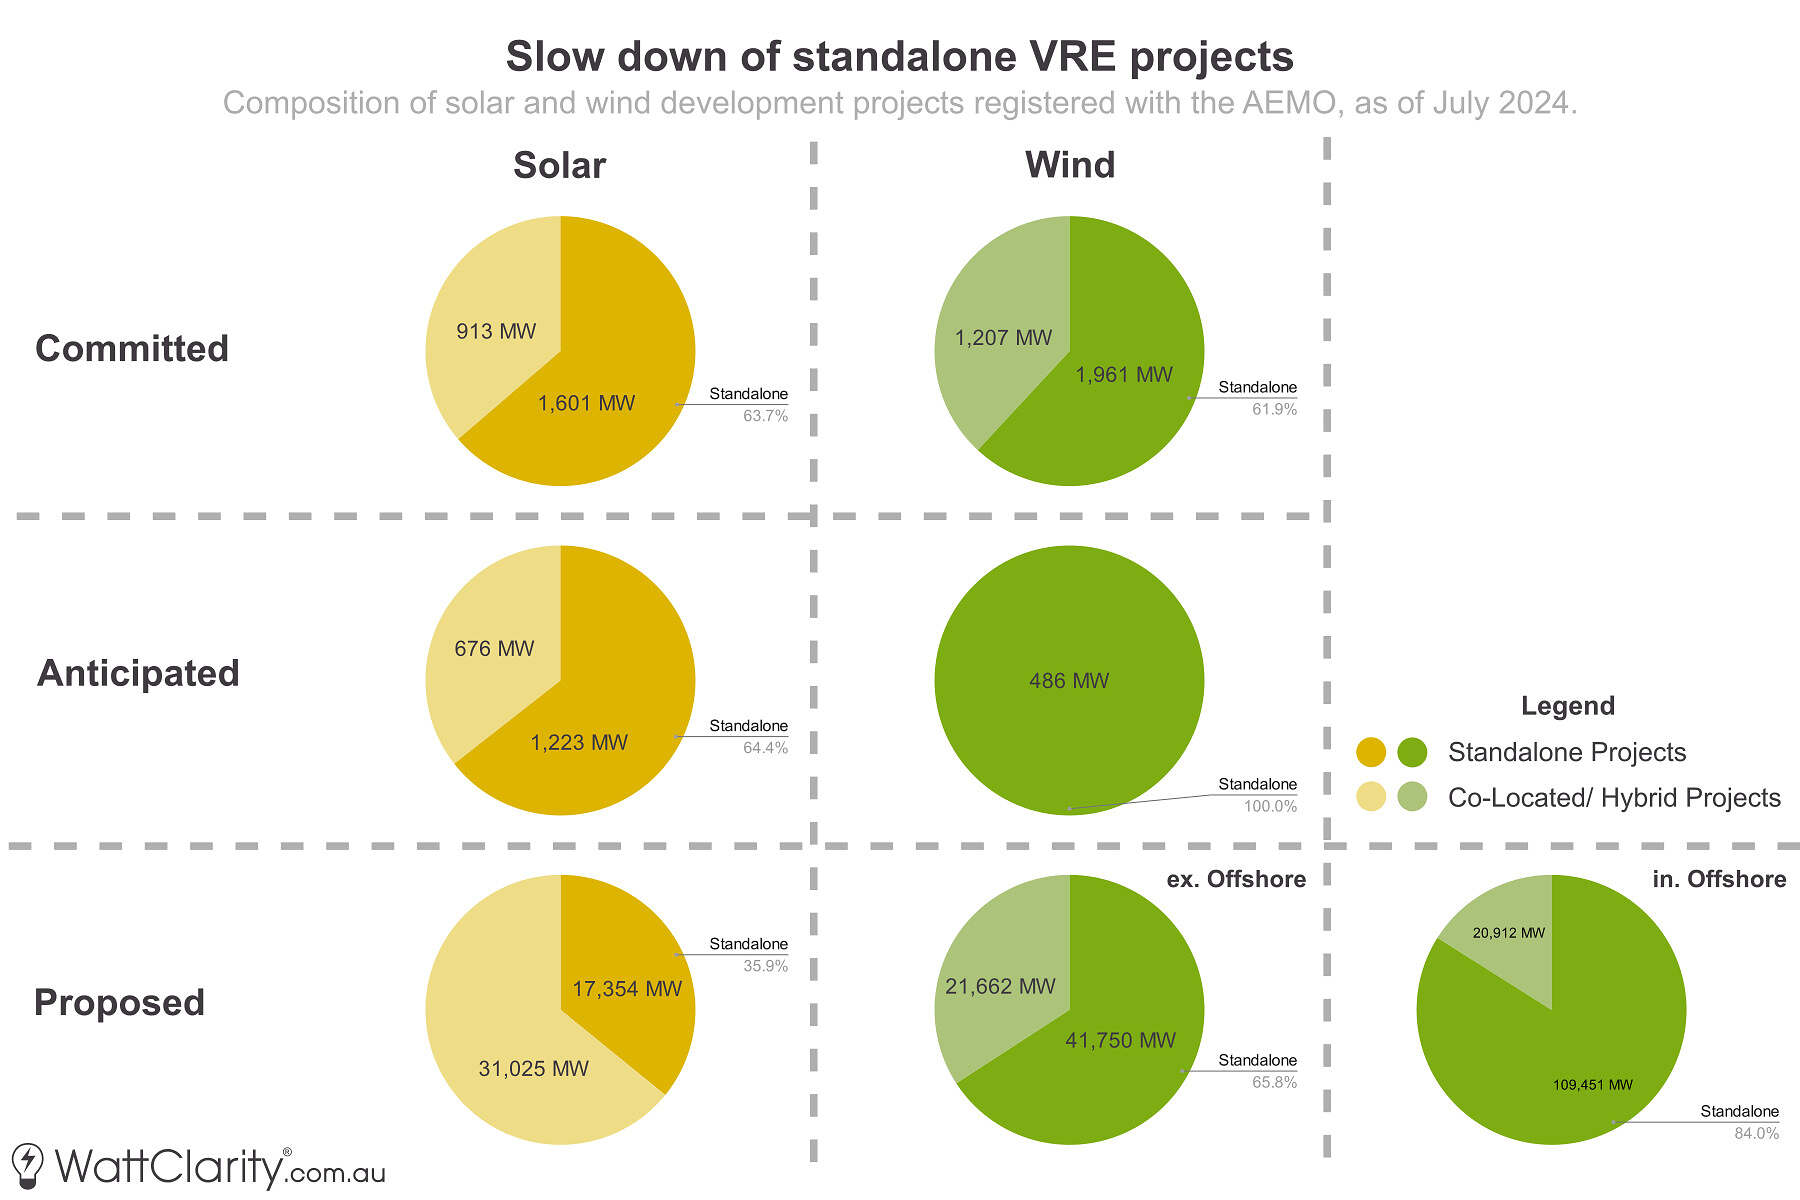
The development pipeline indicates an eventual slowdown of standalone solar projects for proposed projects.
Source: AEMO Generator Information
The shortlist from the first generation tender of the Capacity Investment Scheme demonstrated that non-standalone projects scored higher, particularly in Merit Criteria 1 (contribution to system reliability and system benefits) which has a 40% weighting in Stage A of the scheme.
So, hybrids to the rescue?
Whether these challenges can be solved with ‘hybrids’ is where the distinction between co-location and single-unit IRPs begins to matter.
The NEM has zonal price formulation based on unit-level bidding. The introduction of ADC helps alleviate some of the conformance burdens for semi-scheduled solar/wind if they are co-located – but units will still bid independently of each other. In that sense, the co-locating of units even as a single station will have no more of an effect on the bid stack than ‘the sum of the parts’ would. Therefore in terms of system benefit, it is hard to distinguish the value of battery co-location from the value of batteries.
However, co-location may offer the asset operator some value from a risk management and diversification perspective. For example, it may provide a greater ability for the operator to unwind a network constraint – as batteries can have both positive and negative contributions within a constraint equation. However, it is also worth noting that co-located units part of an ADC group must conform individually if a constraint is applied to a singular underlying unit. This limitation can be specific to the type of constraint equation (e.g. stability constraints), as detailed in the ADC Fact Sheet. Co-locating a battery may also provide a partial physical hedge against a falling MLF or certain types of locational constraints – something that had otherwise been difficult to hedge against.
As mentioned, we are yet to see any single-unit IRPs register yet. Greenfield projects that have progressed with announcements in recent months such as Gawara Baya and Quorn Park appear to have opted against the single-unit IRP model – so early indications show that the additional complexities are still a barrier at this point in time. These additional obligations and forecasting complications have been previously covered by Ellise Janetzki here on WattClarity.
Key Takeaways
As always in the NEM, there is no shortage of issues and no shortage of complicated rule changes aimed at addressing such issues – but I’ll finish with a couple of takeaways:
- The challenges for standalone solar and wind are multifaceted. The majority of projects in the committed and anticipated queue are still earmarked to be standalone – meaning that these issues may be further compounded in the near term.
- Hybrids ain’t hybrids. From a dispatch (as opposed to settlement) perspective, a key difference exists between (1) co-location and (2) a single-unit IRP. It may be simpler for developers to build control systems and register co-located systems, but the value of instead registering as a ‘single-unit IRP’ is not yet well understood. Until we see those enter the market, this will remain a theoretical debate.


Great summary Dan, as always, thanks for posting.