
Its been great to see the GSD 2023 come together in recent months and be released this week, especially since this is now the fifth year in a row, which has allowed us to view the changing generator profiles over this time.
As someone who watches the market closely, including in a monthly report for some clients, I am always amazed at the daily min/max chart across the year that is included for all generators but is especially interesting for the coal generators.
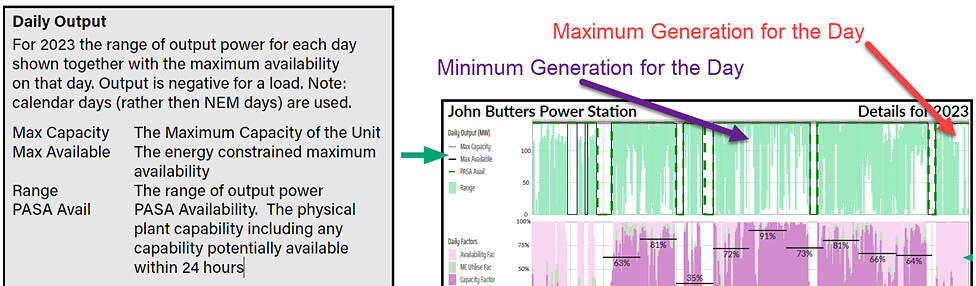
What is the Daily min/max chart?
As the glossary for each of the ‘B’ Pages for each DUID shows, we include a chart at the top of each page that has the daily minimum and maximum MW generated for the day, as well as the available capacity and the new information, what was its PASA Availability which is especially helpful for understanding whether it was recallable, hence off for commercial reasons (see the commentary below on Gladstone units).
What we can see in GSD 2023
Having read through the AGL half-yearly presentation last week (which Dan also mentioned today), we were interested to see the comments related to reductions in minimum generation at Bayswater, so we analysed those units first to see what it showed.
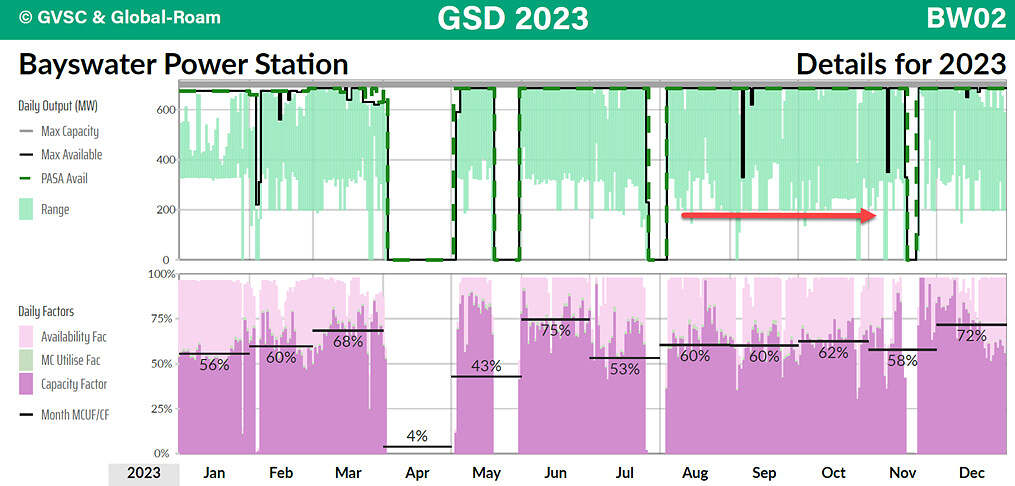
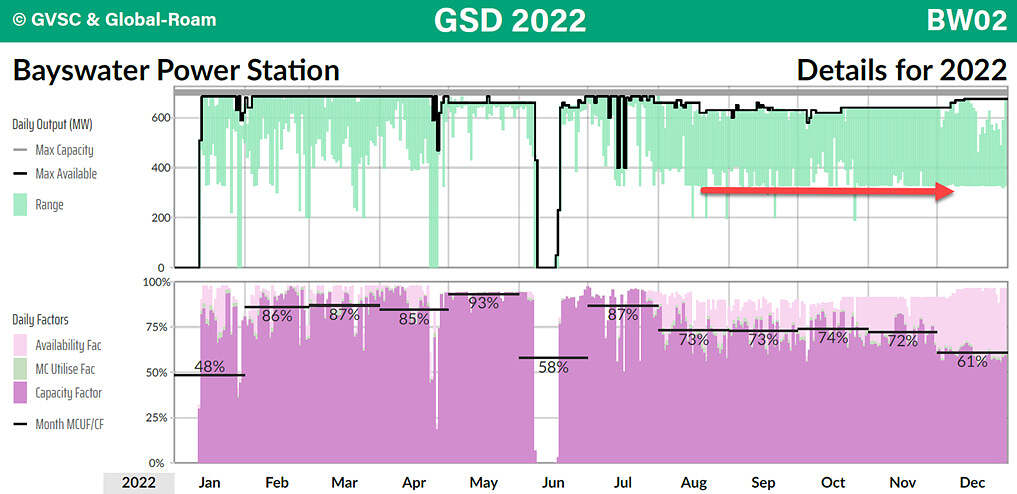
From the above chart of BW02 from the GSD 2023, we can see that in January the lowest the load got to was 330 MW, but then from February the unit began loading down to 200 MW. From July loading down to 200 MW became more frequent. And whilst there is a clear trend for 2023, it is only when we look back to GSD 2022, for the same unit, that we can see the clear differences, as shown below. In GSD 2022, we can observe the unit rarely going below 330MW. When it does go down to around 200 MW it appears it is for testing purposes, otherwise the minimum load on BW02 in 2022 was ~330 MW. Given the continuing demand reductions in the middle of the day, this additional 130MW of flexibility on BW02 which has been used since February 2023 would be extremely useful.
What are other units doing?
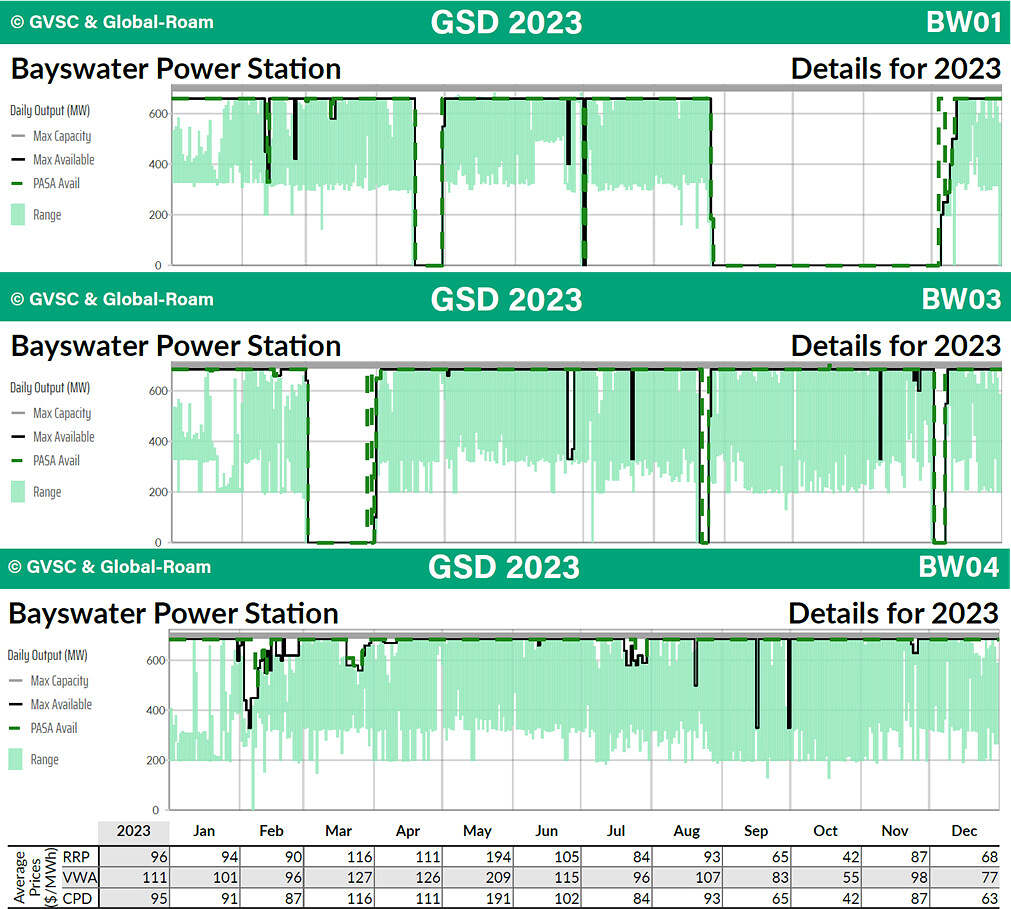
We can see the same patterns repeated on units BW03 and BW04. In 2022 minimum load on these units was rarely below 330 MW, but from 2023 minimum load down to 200 MW was a near daily occurrence. It seems BW01 had not yet made regular use of lower minimum loads like the other units, but we expect it won’t be far away. Achieving lower minimum loads on Units BW02, BW03, and BW04 last year was timely because prices from July to December in NSW (as shown by the monthly RRP for NSW) were considerably lower than the first six months of the year. For completeness, the VWA is the volume-weighted average RRP for each unit (the below table shows BW04), as well as Connection Point Dispatch (CPD) price or the effective nodal price. You can see the lower generation when all four Bayswater units will reduce the required generation by up to 520MW in the middle of the day, a significant benefit to the AGL portfolio and also the system.
So what are other portfolios doing?
This time, using the TSV Data Extract of all the GSD2023 (and prior editions), we were able to develop up a few extra charts to see the trends over time for the coal fleet, using the minoutput field in the tables to see a history over time. Given we have data back to 2019, we have included all the years here.
We used the minoutput field, divided by the maxcapacity to give a percentage value to allow us to normalise the results across regions and stations. By removing a few of the daily outliers for unit start ups, shutdowns and maintenance issue, each dot in the below charts represents the daily minimum generation (expressed as a percentage to max capacity) for the last 5 years for the VIC brown coal fleet.
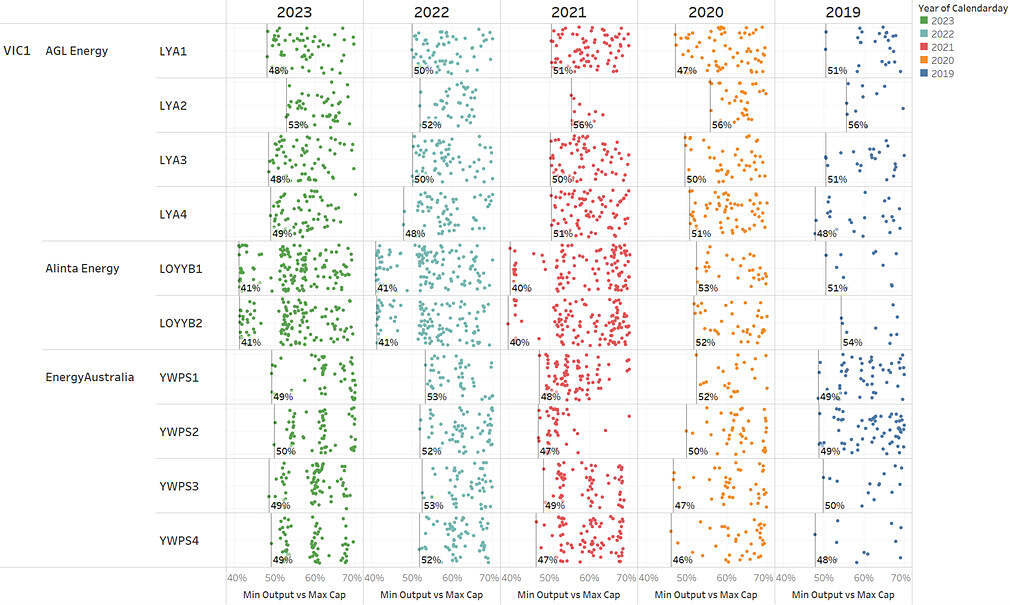
It shows that since 2021 Alinta’s Loy Yang B began to regularly operate down to around 40% of capacity (approx. 250MW output). In this chart it is also interesting to see the distinctive operating levels of the Yallourn units at approx. 50, 60 and 70% capacity.
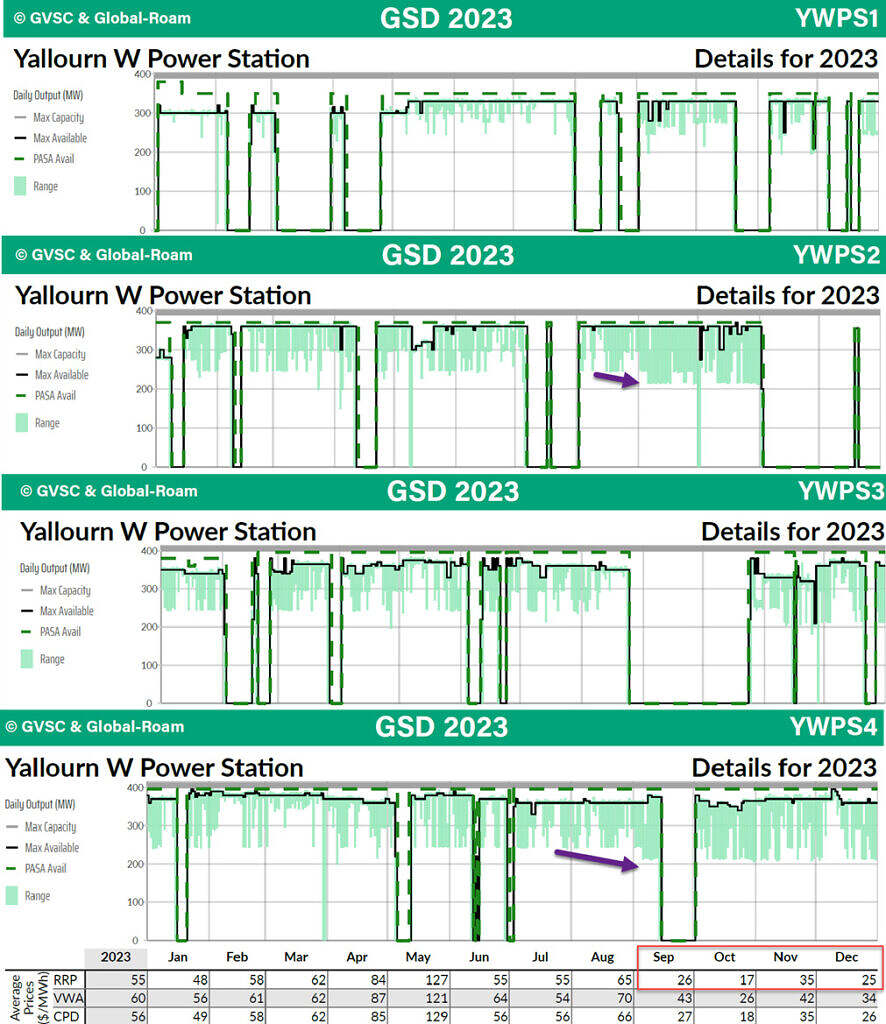
When we look at the actual charts for Yallourn, we again see a trend for lower operating levels in the second half of the year to make way for higher wind and solar generation (and hence lower average monthly RRP which barely made it above $30 for the months Sep – Dec).
What about trends in other regions?
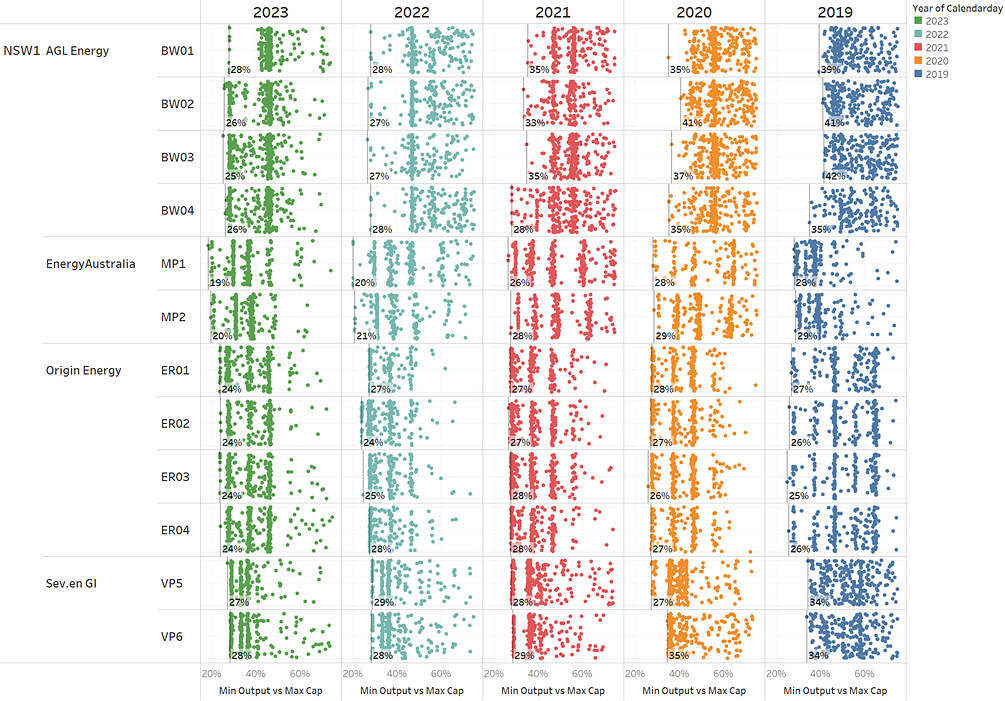
The decreasing output trend on Bayswater is clear to see, dropping from around 40% of capacity in 2019 to 25% in 2023. A similar trend occurred at Mount Piper (MP1 and MP2) in 2022. Eraring has been capable of minimum loads down to 30% in recent years but at the end of last year showed signs of even lower minimum loads with 25% loading achieved in December 2023, which is a good result for a station that was already flexible.
The preferred and consistent operating levels of the unit are also clear to see in the below NSW chart.
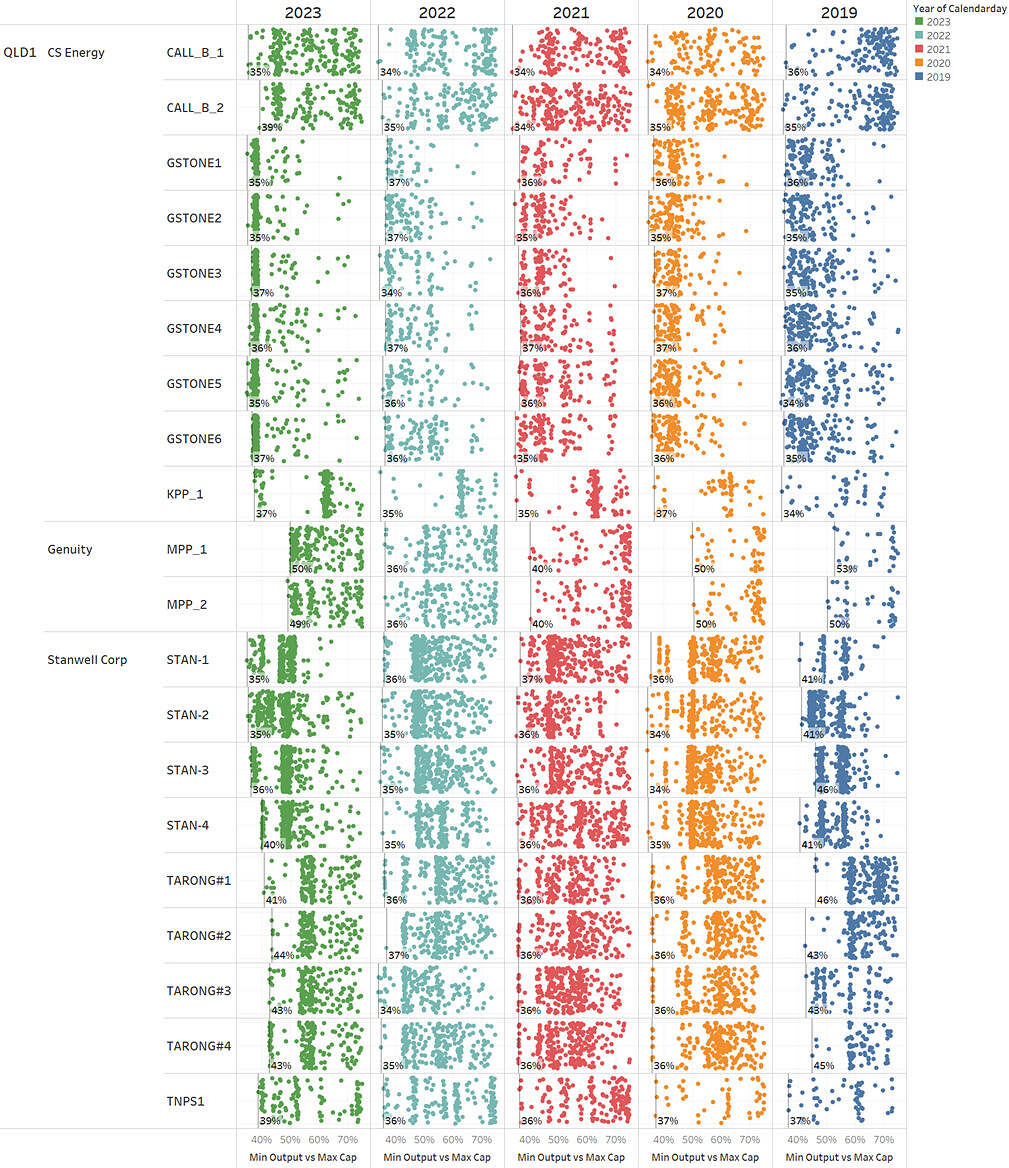
When it comes to QLD, despite 5 years of data, there appears to yet be significant changes in minimum operating level.
Having said that, and as noted above, these operating range charts also allow us to see the PASA availability (the indicator to AEMO that the unit can be recalled from an outage). Each of the green arrows indicates a period where a unit is offline, but still PASA Available (can potentially be returned in 24 hours), hence its outage could be considered commercial in nature, rather than technical. We do wonder whether lots of people analysing key generator information have failed to make the distinction!
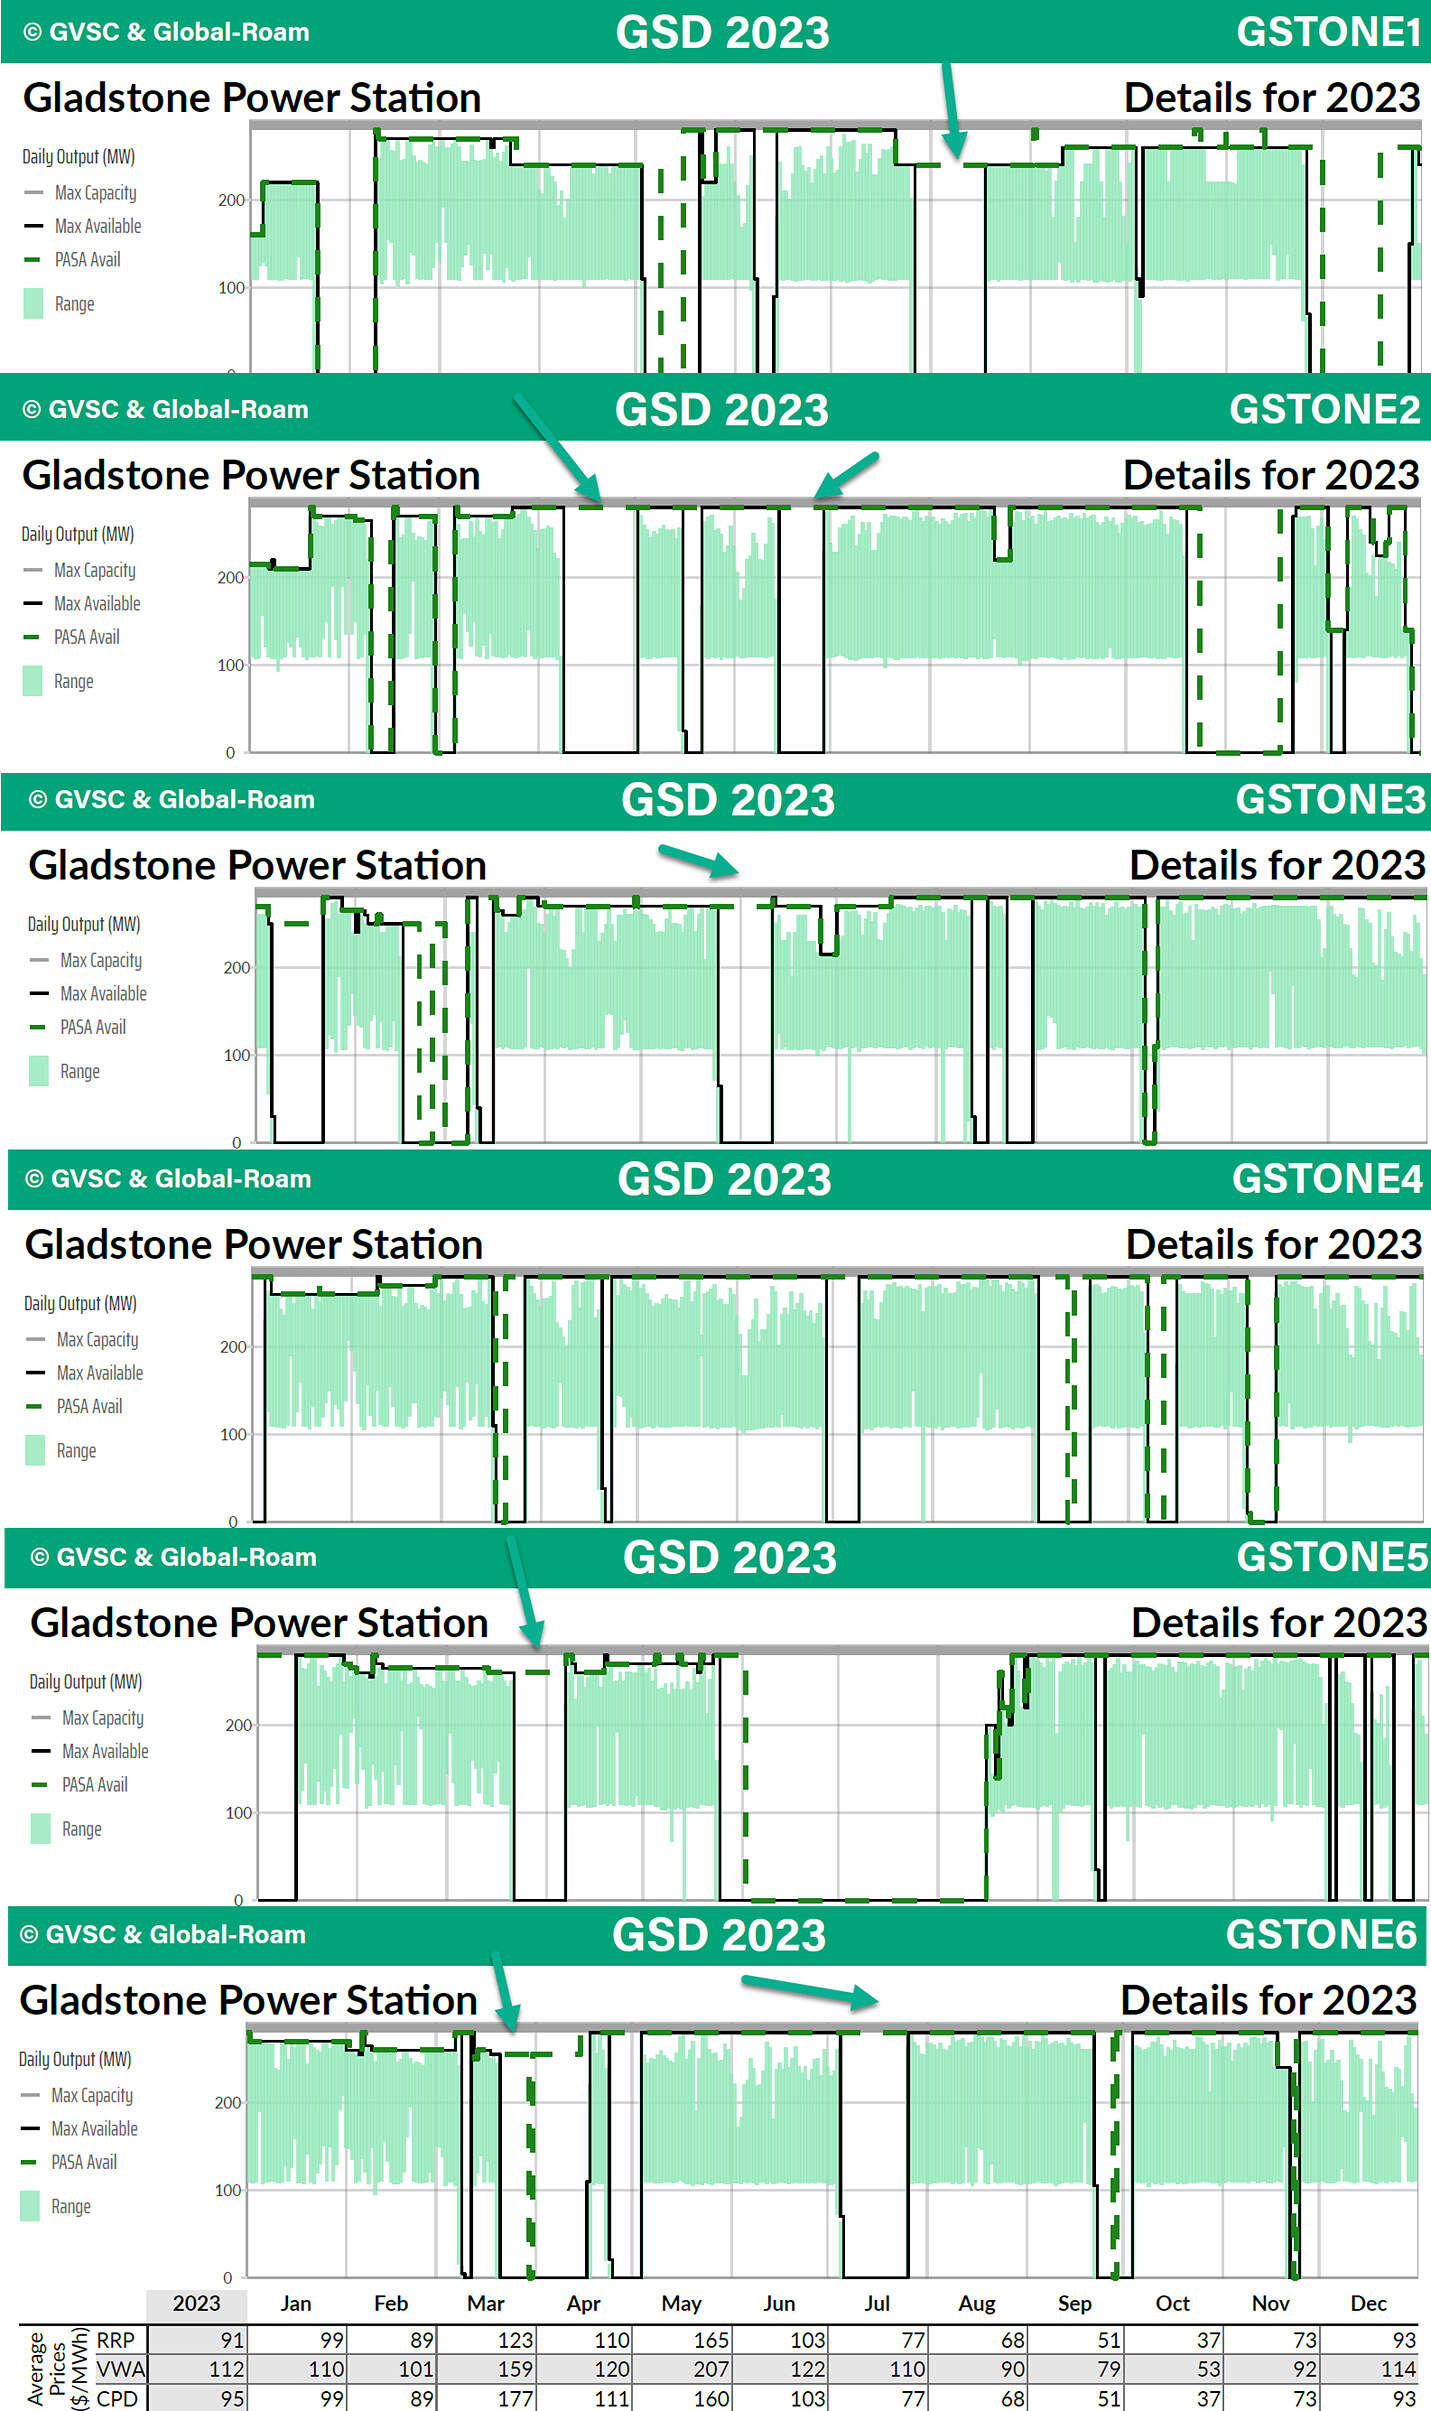
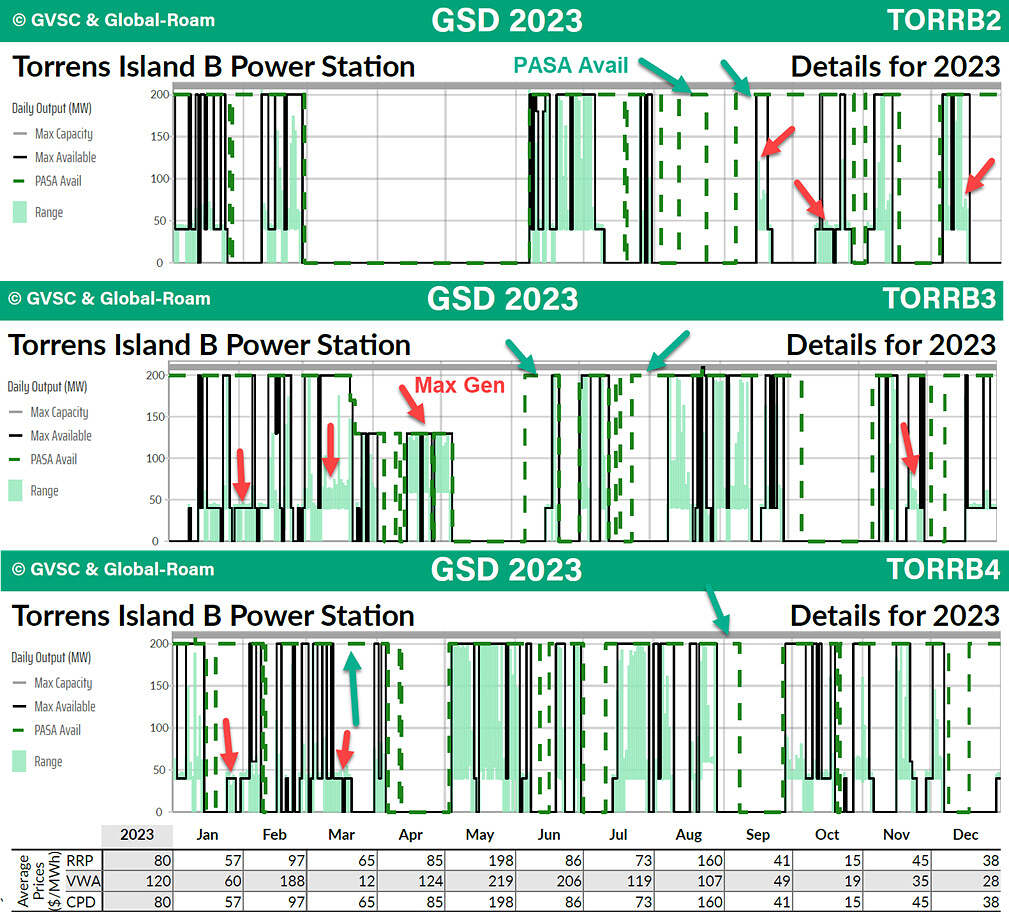
A similarly interesting pattern can be observed at the remaining three Torrens B power station units in SA, where at least one unit was PASA Available for all but a few days of the year, despite actual generation being the lowest in the last 10 years for each unit (The ‘A’ page data for Torrens B shows the 2023 annual generation compared to previous years – a great handy reference for all generators). When the output range charts are collated for the Torrens B units, a few clear observations can be made:
- There are many days where Torrens B units are fully PASA Available, fully Available to the market, but not generating above 40-60MW for many days in a row.
- Similarly, the min generation level of 40MW is clearly visible (this represents 20% of max capacity which is a very good level for a steam generator – Torrens B is a gas boiler, steam generator)
Conclusion
The GSD 2023 is a fantastic resource to really understand what is happening in the NEM. Whilst lots of comments and opinions occur, this resource allows fact-from-fiction to be understood and the real metrics of the generation fleet to be analysed in pictorial form, and when combined with the TSV data file for specific analysis by unit, the power of these statistics are clear for all to see.
About our Guest Author
|
|
Nick Bartels is a Senior Consultant at Greenview Strategic Consulting.
Greenview Strategic Consulting was formed to provide specialist market advice to energy, government and community organisations in the complex domain of energy and critical infrastructure. You can find Nick on LinkedIn here. |

Leave a comment