As noted over the weekend, on Saturday 21st September we saw a new ‘lowest’ point for Market Demand in NSW … and that record was short-lived, being pushed lower still on Sunday 22nd September.
In the NEMwatch snapshot from Saturday’s article we see negative prices everywhere … including –$801.06/MWh in the QLD Region (which reminds me of the warning some years ago about ‘crunch coming …’ … albeit that that warning was more specifically about oversupply in northern QLD)!
Back on 2nd September we’d written ‘Curtailment of Solar Resource from (Semi-Scheduled) Large Solar across the NEM reaches 79.2% on Sunday 1st September 2024’ following a similarly low demand weekend period.
… That article stuck a chord, being referenced in Mainstream Media and well across Social Media in particular.
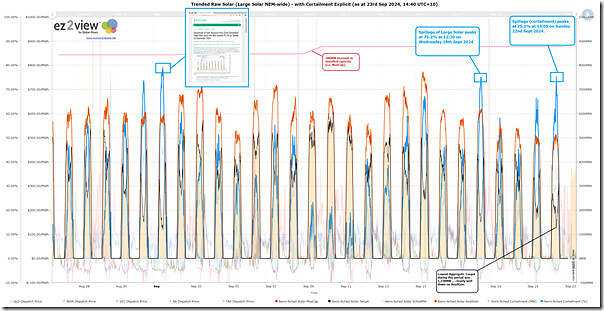
I wondered how the recent weekend had prepared, so I modified that piece of analysis in the ‘Trends Engine’ of ez2view to look back 28 days to see the following:
From this chart we can see that the Sunday 1st September 2024 still holds the record (in this short time-span, at least) for ‘most curtailment in percentage terms’ … but close behind were:
1) Wednesday 18th September 2024, peaking at 75.2%; and
2) Sunday 23rd September 2024, peaking (also) at 75.2%.
Causes of Curtailment?
At this point it’s useful to remind readers of Marcelle’s note of caution … ‘Not as simple as it appears – estimating curtailment of renewable generation’ from 2020.
In the chart above we focus just on Semi-Scheduled units (i.e. excluding a few smaller Non-Scheduled units) and look at the difference between Availability* and Target.
* With respect to Availability, remember Linton’s note about ‘What inputs and processes determine a semi-scheduled unit’s availability?’ that outlines some of the complexities about this … and possible sources of inaccuracy.
With these caveats in mind, remember that Curtailment might be for a number of reasons, but primarily two main ones:
Reason 1 = Economic Curtailment
i.e. when prices are lower than a generator might be prepared to pay (remembering that, following the AER Rule Change, the AEMC clarified that Semi-Scheduled units could only facilitate this via their bids).
Reason 2 = Network Curtailment
i.e. constraints or congestion.
Analysis of, and discussion about, Curtailment?
In recent times there has been some discussion about curtailment on WattClarity:
1) On 2nd May 2023, Tristan wrote ‘Australia’s Renewable Energy Boom – The Good, The Bad and the Downright Ugly’, drawing on the GSD2022.
2) On 9th May 2023, Allan wrote ‘Renewable curtailment – forced and not quite so forced’.
3) Then in 2024, with reference to the GSD2023, Dan Lee wrote:
(a) On 7th March 2024, Dan wrote ‘Keeping Up with the Curtailment: 3.7TWh of semi-scheduled economic and network curtailment estimated in 2023′.
(b) On 2nd May 2024, Dan wrote ‘Keeping Up with the Curtailment Part 2: The what and the where’.
… amongst other articles, some of which have been categorised under ‘Curtailment of VRE’ and/or tagged with ‘curtailment’.
Glass half full, or half empty?
In mainstream media I’d noticed last week that Angela Macdonald-Smith had written about how ‘Solar farm output wastage tops 99pc in South Australia’ in the AFR on Wednesday 18th September (coincidentally on a day seeing large curtailment right across the NEM).
Following Angela’s article I’d also seen a range of commentary (ranging all the way up and down the Emotion-o-meter), which I’d perhaps overly simplify by summing up as follows:
1) The glass half-full view…
… the roll-out of rooftop PV is going gangbusters, and that is something to be celebrated. The roll-out of different types of storage will mean that these curtailment challenges will only be temporary.
2) The glass half-empty view …
… the negative prices and high levels of curtailment during shoulder seasons are undermining the business case for rolling out any more Large Solar.
3) And, of course, there are those who Gary Larson summed up as Personality Type #4 in the epic cartoon ‘hey! I ordered a cheeseburger!’. The Energy Transition has its share of those types …


Leave a comment