
Firming capacity increasingly critical
The last few weeks, and much of the winter, has repeatedly helped draw our attention back to the role of firming electricity supply during periods when VRE is low and electricity demand is elevated.
We’ve seen how an extended late-July cold snap coincided with transmission limitations to send prices to the roof in SA and wider – one such run of three days was noted by Paul here on WattClarity.
And that same period demonstrated how storage systems don’t have perfect foresight, covered in Allan’s article “With the benefit of hindsight – or who’d be an auto-bidder?“.
And, with what we attribute to low rainfall in TAS, reduced hydro generation capability supported Tamar Valley’s GPG running for almost 7 weeks straight.
Gas-powered generation (GPG) is a critical source of electricity supply now, for peak periods, and is expected to continue to be over the coming decade(s). It seems this winter has seen it be relied upon no less than before.
Gas storage for the south: Iona Underground Storage*
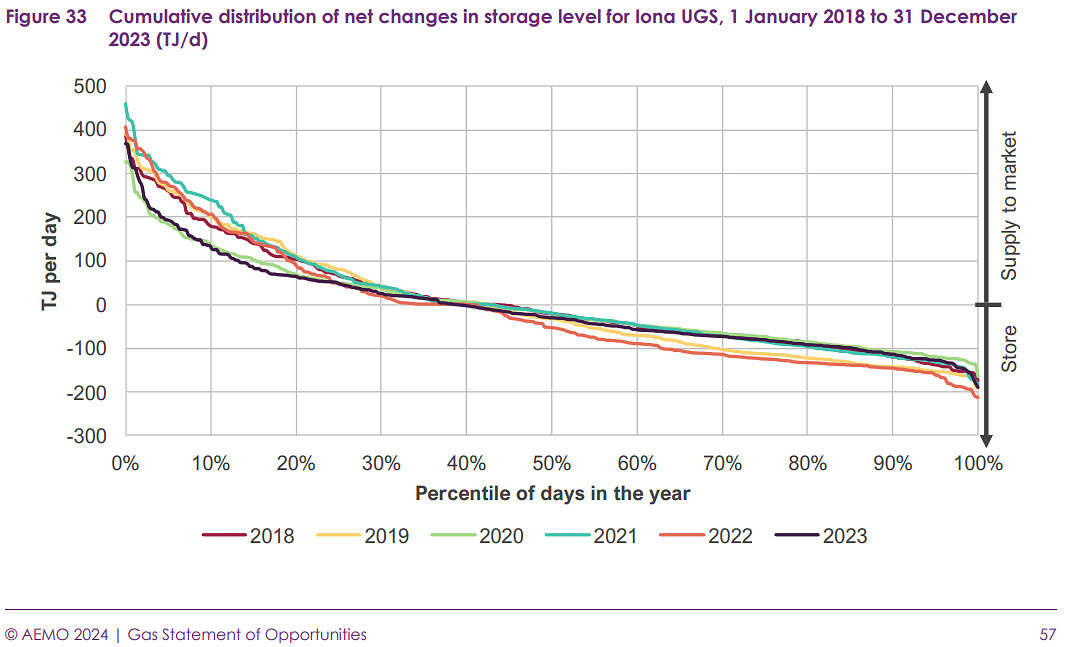
In the current GSOO (March 2024), in the discussion on midstream gas infrastructure (this is the linkage between gas producers and gas consumers), Figure 33 of the report demonstrates that Iona UGS is routinely relied upon to inject at high rates [withdraw from storage] to support demand. *There is shallow storage for the south but peak volumes stored are generally up to around 2,000 TJ – less than a 10th of Iona’s capacity.
Here’s that Figure 33 of the GSOO, mentioned earlier:
AEMO’s 2024 GSOO
The GSOO noted 2021 and 2022 saw the greatest daily withdrawal in the past five years, both above 400 TJ/d. And since that time of publication, the 2024 peak withdrawal rate has entered the rankings.
This year, 2024, the 17th July saw a withdrawal rate of 432 TJ/d, making it the second highest on record since 2018.
2021’s max rate was 460 TJ/d and the now third highest was 2022 at 407 TJ/d.
In 2024 there were additionally 3 other days with withdrawal rates over 400 TJ/d.
The max withdrawal rate is now 570 TJ/d.
The GSOO remarks that “Deep and shallow storages are forecast to continue to provide critical injection capacity close to large demand centres downstream of north-to-south transmission pipeline constraints. Storage levels will require appropriate management to ensure maximum injection rates can be provided on peak days and/or sustained across multiple high demand days when necessary. Under extreme weather conditions, the existing capacity provided by storages is still forecast to be insufficient to avoid gas shortfalls.”
Due to this, we review Iona’s storage levels to-date.
Storage levels at Iona
For the 2024 winter, Iona’s capacity is 24,500 TJ owing to the completion of upgrades in 2023. In the 2023 GSOO analysis charts indicated the minimum operable storage level is about 6,000 TJ.
The following chart shows how storage levels have changed since 2018.
This year, 2024, storage was at a relatively high level in January owing to lower than average gas demand in 2023. The storage level managed to climb higher by April which is the typical time for peak storage levels prior to winter. Since May 2024, levels have steadily dropped with withdrawals.
Currently the level sits at 10,134 TJ, at the end of gas day 4 August 2024.
An outlook?
Storage levels will of course relate to production, transfers and demand for gas (and electricity). So the contributors to storage levels are numerous and complex. Yet, from the chart, we can observe brief periods of decline are still possible into in September although these are usually among days when the net level is increased.
Therefore, some further declines may still occur but history suggests we are turning the corner soon on storage levels at Iona, in time for refilling for the 2025 winter.
You can just imagine where this would go had Eraring closed as scheduled – its energy overwhelmingly would have moved to OCGTs resulting in higher capacity factors. People need to understand that gas is not the same as coal – coal stockpiles are easy – managing instantaneous demand flows in a gas system is difficult and will cost money. Pipelines, compression and localised storage. LNG storage starts to look sensible. You need a very big battery to store the energy equivalent of a 50,000 tonne tank of LNG. Otherwise you end up in liquids. And the logistics and costs get eyewatering.
Hi there, sorry if this is a dumb question but why do gas storages on AEMO’s GBB dashboard continue to empty when there is a net surplus of supply over demand? For example, right now (Tue 8 August 14:35) there is supply of 5,721 TJ and demand of 5,580 TJ giving a net supply of 132 TJ. Yet Iona, Moomba, Roma and Silver Springs storages are all emptying with an aggregate rate of -76 TJ. Shouldn’t these 2 numbers be the same unless gas is being lost somewhere in the system?
Hi Andrew, I probably can’t give you a firm answer but, initially, two reasons come to mind. Yes, there is a thing they call UAFG – unaccounted-for gas – that represents fugitive losses along the network ~3 – 5% ish. Secondly, The AEMO note on Demand in the GBB (fur the current day) suggests that some calculations are performed for VIC and some demand for gas powered generation data might be excluded due to the methodology.