It’s probably news to noone that Australia’s a continent of two halves at present, dominated by a high pressure system in the north and a low pressure system off the southern coast – leading to:
Half #1) baking winter* heat in the north; and
* yeah, right, ‘winter’ in name only!
Half #2) wild winds in the south.
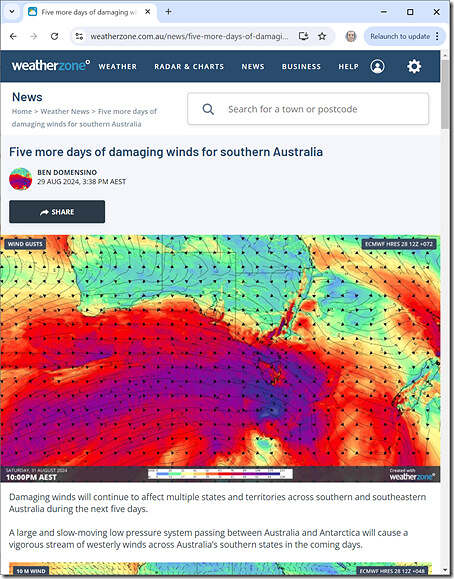
So it’s not really a surprise to see that Ben Domensino wrote about ‘Five more days of damaging winds for southern Australia’ on Weatherzone yesterday:
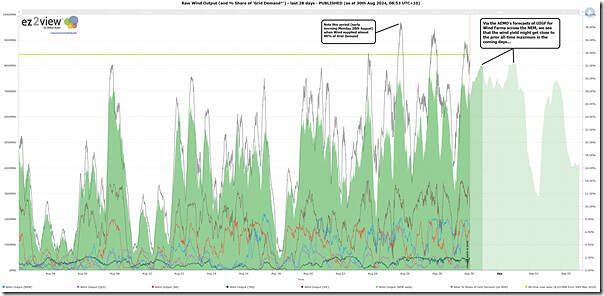
I wondered what this might mean for aggregate wind yields over the coming days, so firstly jumped to this pre-prepared trend from ez2view looking at:
1) actual wind production levels (backwards in time); and
2) AEMO’s UIGF (forwards in time … noting that this is a forecast capability, and that the output might be moderated by VRE curtailment for economic or network reasons)
Highlighted on this chart are:
1) A period early morning on Monday 26th August 2024 when aggregate wind yield
… noting that Grid Demand is diurnally low at that point
2) Forecast peak in wind capability above 8,000MW over the weekend:
(a) Just above 8,000MW briefly in the early hours of Saturday 31st August 2024; and
(b) Slightly higher in the early hours of Monday 2nd September 2024.
(c) Both of which might go close to the all-time record set on Thursday 30th May 2024.
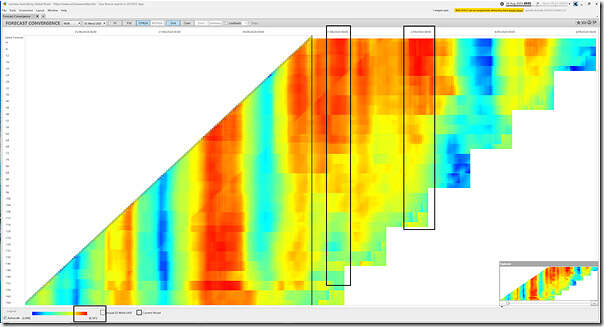
Wanting to see more dimensions to this query, we shift to the ‘Forecast Convergence’ widget in ez2view and flip to NEM-wide UIGF for Wind:
‘Looking up the verticals’ highlighted to ‘see that other dimension of time’ we see that the forecast wind capability has been growing over AEMO’s successive forecasts … so definitely hold onto your hats this weekend!


Leave a comment