Last week we released GenInsights Quarterly Updates for 2024 Q2 … this followed form our belated release of the same for 2024 Q1. In that article I noted that we’d look to share a couple excerpts.
Yesterday we posted the first excerpt, in the form of ‘Coal-fired unit performance has improved markedly from the ‘dog year’ that was 2022’.
Today we’re going to include a second excerpt from the broader analysis of ‘Aggregate Scheduled Target’ (AggSchedTarget) … which is
1) a metric we’ve been tracking in the GenInsights Quarterly Updates series of reports is series of report.
2) and is a good proxy for the requirement for Firming Capacity to complement the growing contribution of VRE.
(A) Prior discussion about Aggregate Scheduled Target
This metric was first introduced in Appendix 15 within GenInsights21 … with analysis then continued into GenInsights Quarterly Updates (in Appendix 4 therein).
Here on WattClarity, you will find articles utilising this metric:
1) Collated under the ‘Requirement for Firming Capacity’. category; and or
2) Tagged with any of the following:
(a) AggSchedTarget; and/or
(b) ‘Aggregate Scheduled Target‘; or occasionally
(c) ‘Demand met by fully dispatchable supply‘
… these articles include a growing number of Case Studies.
(B) Recent statistics, from our Q1 and Q2 Quarterly Updates
With that background out of the way, let’s look at some recent results …
(B1) Looking at absolute Aggregate Scheduled Target
In this article we’ll specifically focus on one particular permutation of the AggSchedTarget metric:
1) That being the absolute level across a dispatch interval of the Target for all Scheduled units.
… noting that we’re deliberately focused on a NEM-wide measure so we can ignore any rabbit hole pertaining to inter-regional transfers (and/or transfer capability).
2) And, indeed, we’ll only focus on the high points in this article.
(B1A) Results for the 2024 half-year
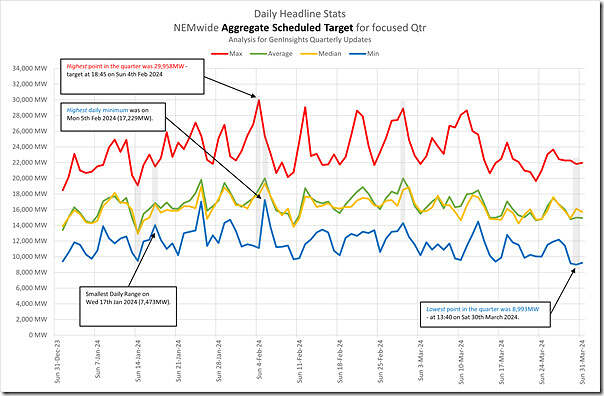
Extracting from our detailed reviews for 2024 Q1 and 2024 Q2, we’ll start with these trends of daily headline statistics for each of the quarters in focus for those reviews:
Daily Results through 2024 Q1
Here’s one of the charts published in our review of 2024 Q1 showing the daily headline statistics:
With respect to the days noted above:
1) We’d previously posted ‘Case Study of NEM-wide Aggregate Scheduled Target on Thursday 18th January 2024’ – noting that:
(a) That day’s not really a standout in the chart above; and that
(b) The reason for that article was a large 5-minute ramp in AggSchedTarget.
2) Noting that Sunday 4th February contained the highest point in the quarter (albeit below 30,000MW) it’s worth noting the prior article ‘Case Study of NEM-wide Aggregate Scheduled Target in early February 2024’ that included reference to:
(a) The article ‘NEM-wide ‘Market Demand’ reached 32,938MW on Sunday 4th Feb 2024 (updated)’; and also
(b) This ‘Brief Case Study of Sunday 4th February 2024, with low IRPM following high Market Demand’.
Daily Results through 2024 Q1
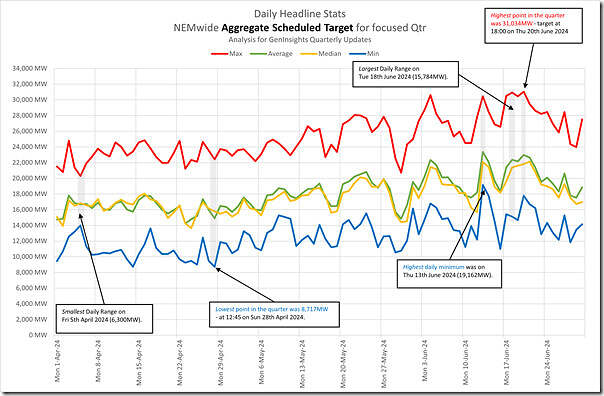
Here’s the same chart for 2024 Q2:
Noting the highest points in the quarter occurred in June, it’s worth pointing back to some particular days – such as:
1) In the first full week:
2) In the second week:
(a) Wednesday 12th June 2024;
3) In the third week:
(b) Tuesday 18th June 2024;
(c) Wednesday 19th June 2024; and
(d) In particular Thursday 20th June 2024 (given it saw the highest point in the quarter … and the 2024 year to date).
Readers will understand that there were several factors driving this, including three big ones:
1) Cold weather driving higher Underlying Demand; coupled with
2) Winter evening peak in demand being after sunset; and (through 2024 Q2 in particular)
3) Quite poor wind output through much of 2024 Q2.
(B1B) Longer-term trend
Noting that the highest point in the quarter was above 31,000MW (and indeed that several days saw maximum points above 30,000MW):
1) it’s worth referring back to the longer-term trend for these statistics that was published in the article ‘We’re not building enough replacement dispatchable capacity’ (i.e. firming).
2) But remember that (at that time) results had only been compiled till the end of 2023 Q1.
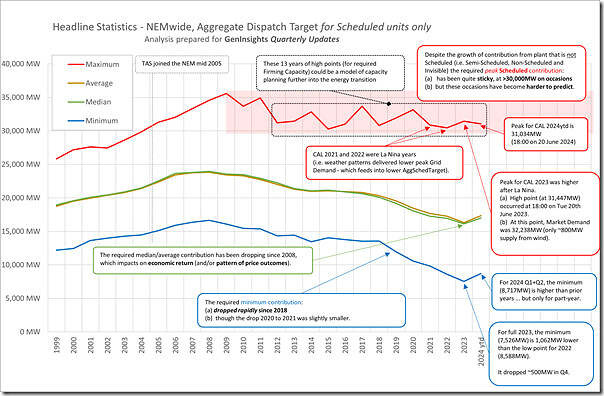
Here’s the updated trend, now with results for another 5 quarters added on:
In this chart we’ve drawn a box around the high points across each of the past 13 years to highlight that they are all quite similar … especially considering that we’ve added a large amount (well past 40GW?) of VRE plant over a similar time range (with ~22GW of Large Scale and more than 20GW of rooftop PV).
As noted on the image, there’s a few headline observations that can be drawn:
1) At the bottom end (in blue) the annual minimum points for AggSchedTarget has been dropping sharply (by ~1,000MW each year) in recent years;
2) For the medium and average points, they have also been dropping since 2009
(a) which speaks to the ‘area under the curve’ (i.e. the volume of energy required to be generated by this firming capacity)
(b) hence economic challenges for assets that are high capex and low opex … such as:
i. pre-existing (and formerly ‘baseload’) coal fired generation – which are increasingly economically challenged (even if their technical performance has improved markedly in the past 18 months).
ii. also for possible deployment of new options (such as nuclear), if we were to assume that they’d continue running in the same challenged way that coal units need to run (though I won’t fall further into that rabbit hole).
(c) the top points (i.e. annual maximum points), however, continue to reinforce that we require firming plant with available/unconstrained capacity (i.e. not just installed capacity) roughly greater than the peak demand seen in the grid in a given year.
(B1C) Count of high points per year
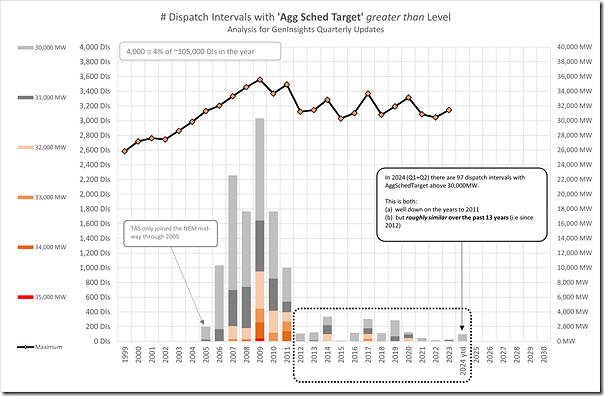
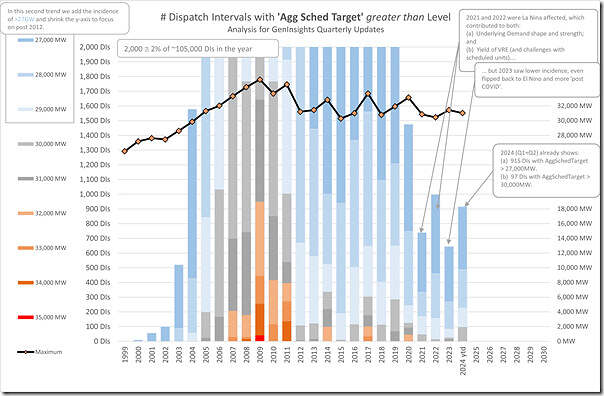
To help the subscribers to the GenInsights Quarterly Updates form a fuller picture of requirement, we’ve also been adding in these trended duration plots, which count the number of dispatch intervals in each year seeing AggSchedTarget greater than 30GW:
We can see in this trend that the past 13 years (again highlighted) has seen roughly equivalent number of dispatch intervals of very high requirement for firming capacity.
… This is important to note – especially given that:
1) 2024 ytd is only spanning 6 months
2) yet has seen more dispatch intervals than 2021, 2022 and 2023 (and also more than some earlier years as well)
Taking a step further and adding in the count of dispatch intervals with AggSchedTarget above 27,000MW we see the following:
With only half of the 2024 year counted in the stats above we see that the count is:
1) Larger than for full year 2021 and 2023 (which were La Nina affected)
2) Almost as large as fully year 2022
3) Suggestive that the full year results might be greater than for full year 2020.
Readers should note that 1,000 dispatch intervals equates to ~83 hours, or 3.5 days (if consecutive) … just less than 1% of the year (so not a large period in which to earn a return on what would still be, from a grid perspective, a very necessary investment).
(B2) Assessing ramp in Aggregate Scheduled Target
We don’t have time to cover this now … but it has been assessed previously in GenInsights21 and in each issue of the GenInsights Quarterly Updates
(B3) Assessing predictability of Aggregate Scheduled Target
We (also) don’t have time to cover this now … but this question has (also) been assessed previously in GenInsights21 and in each issue of the GenInsights Quarterly Updates
(C) Questions for later in the week…
In two days (on Thursday 29th August 2024) we expect that the AEMO will release its 2024 ESOO.
Amongst the things we’ll be looking to understand will include:
1) The extent to which AEMO separates from its modelling the requirements for VRE (which is really about energy production) and Firming (which is about Capacity)?
2) If Firming is separately discussed, what AEMO has to say about the level of requirement?


Leave a comment