I’ve been away for over a week, during which time we’ve seen the end of 2024 Q2 … and, catching up on market news today, I’ve seen ongoing commentary about the wind lull through the quarter (amongst many other topics of conversation).
So, before moving onto other things, I thought it would be worth drawing a line through the quarter with these two updates:
(A) Updated long-run stats for NEM-wide wind production
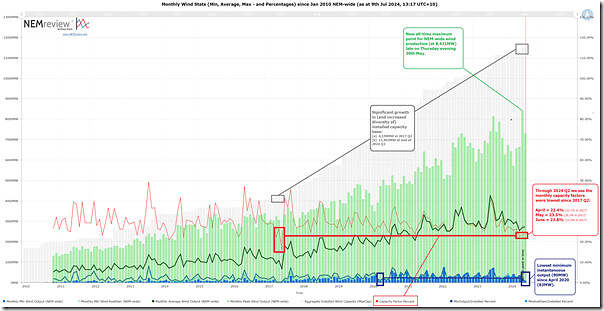
We’ve been progressively updating these long-term wind production statistics, so I thought it would be useful to start with this update via NEMreview v7:
For those with a licence to this software, you can open your own copy of this trend query here.
It’s clear from this trend that the aggregate production levels through 2024 Q2 were the worst since 2017 Q2 (i.e. 7 years ago). Some stats on a monthly basis have been added as annotations … if time permitted we’d aggregate them further to quarters, but that will have to wait (e.g. such as in GenInsights Quarterly Updates for 2024 Q2).
(B) Finalised ‘worm line’
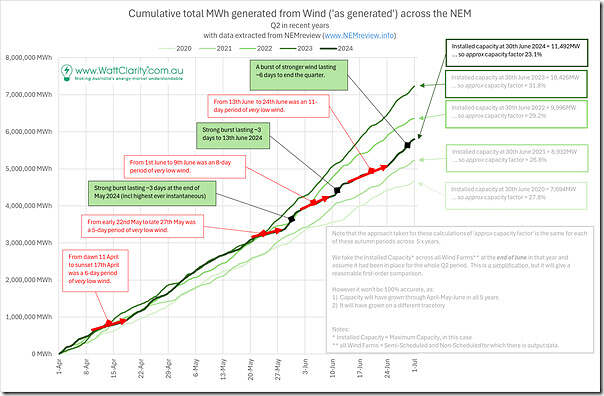
On 1st June 2024 we published ‘More detail on the poor wind yield through (most of!) April and May 2024’ containing 5 ‘worm line’ trends for cumulative production from wind farms across the NEM through April and May of 5 most recent years.
1) Then on 22nd June we extended the ‘worm line’ trend into the month of June (at that point) in the article ‘Where’s the wind gone, through 2024 Q2? … with June perhaps even worse than April or May!’
2) In that article I’d written …
… ‘In aggregate terms, eyeballing the chart it should be relatively easy to see that 2024 might be as much as 3,000,000MWh ‘short’ of wind production through 2024 Q2 compared to what some might have expected’
3) Since that time I’ve seen a few others reference that and (unfortunately) overlook the first use of ‘might’ in the sentence – hence perhaps taking out of context as a forecast from us, rather than a reasoned lower bound.
As it turns out, the wind picked up from around that point through to the end of the month, as a result of which the completed ‘worm line’ chart for 2024 Q2 concludes as follows:
Still a remarkably low result for the quarter:
1) Lower, in absolute terms, then both:
(a) 2023 Q2 … despite over 1,000MW of additional capacity (and diversity of installations);
(b) 2022 Q2 … despite just under 1,500MW of additional capacity (and diversity of installations);
2) Somewhat up on 2021 Q2 … but nowhere near where we might expect it to be with more than 2,500MW of additional capacity (and diversity of installations)
(C) A reminder … different factors can affect low wind output.
Worth repeating the reminder that these charts show aggregate output of wind farms collectively. In reviewing these results, readers should be aware that this output could have been affected by any (or all) of the following factors:
Factor #1 – lulls in the wind resource
There’s definitely been some of this at work in 2024 (e.g. persistent blocking high pressure systems) … but is it the only factor?
Factor #2 – plant unavailability
It’s possible that some wind farms might be experiencing poor plant availability, which would impact … but how would we actually know that?
(a) Since 7th August 2023 the Semi-Scheduled operators have been able to use MaxAvail in the bid to quickly reflect situations such as plant unavailability. Through the remainder of 2023 we saw that many DUIDs did utilise this capability.
i. At this point we have not checked to see how much of this was active through 2024 Q2
ii. But we’re also conscious that, even if we did, the same visibility is not there for prior Q2 periods (so comparing to some historical precedent would not be possible).
(b) However there’s still not complete clarity about physical issues onsite at the Semi-Scheduled units, as the AEMC neglected to extend the responsibilities stemming from ‘the ERM Rule Change‘ to Semi-Scheduled units (as we’ve written concerns about several times before, such as here).
Factor #3 – spillage
It’s possible that some wind farms might also been spilling available energy through one or more of the Q2 periods … if so, that would not be visible in the above.
There are numerous articles written here about curtailment of VRE, with some particularly useful ones collated under the ‘Curtailment of VRE’ category. Remember that ‘spillage’ or ‘curtailment’ might due to several reasons, including two big ones:
Factor 3a = spillage for Economic Reasons
In simple terms, ‘Economic Curtailment’ occurs when the unit does not like the spot price (e.g. it’s below their ‘negative LGC’ break even price) and so they switch off
i. since the AER Rule Change, this was clarified that it needs to happen only through their bids.
ii. However (particularly later through Q2) my sense has been more middle-of-the-day prices at very healthy levels, so I would not expect that there would have been much Economic Curtailment in recent weeks.
1. Last week Dan published this more methodical review of 2024 Q4 prices.
2. This showed a reasonable number of instances of negative prices (in some regions higher than any other Q2 periods) … but we also note that the lowest points were typically above -$100/MWh (so perhaps not lower than ‘negative LGC’ on many occasions to trigger ‘Economic Curtailment’ at any assets … we’d need to look in more detail to see for each wind farm!)
Factor 3b = spillage due to Network Constraints
… in other words, they are being ‘constrained down’ because of localised situations in the network (or sometimes broader reasons, like System Strength constraints).
That’s all for now…


Macarthur Wind Farm has produced nothing since 6 June, which at 420 MW is one of our largest wind farms. Surrounding wind farms have produced well when the wind has blown, and other wind farms connected to the same 500 kV power line haven’t had the same issues.
It is interesting that the wind drought is caused by a succession of high pressure zones which in turn minimised cloud cover, so while wind output was down across the NEM by 10% probably 13-14% adjusting for capacity changes, solar output was up 20% so combined wind and solar output was actually up 5%. The big problem is that hydro output was down 22%, 30% in Tasmania and 40% in NSW so total renewable generation was down 0.1% for the quarter