… it does not seem logical that both can be true, but (from our look at the numbers) it does appear to be!
Let’s explain how…
Current wind yield, on Saturday 1st June 2024
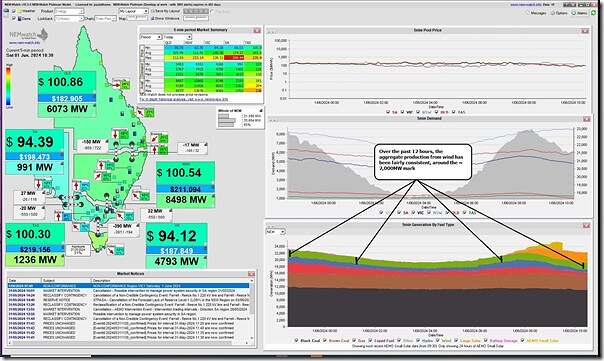
Part of the story is where we are currently at, as captured in this snapshot from NEMwatch for the 10:30 dispatch interval on Saturday 1st June 2024:
As noted on the snapshot, wind yield has been quite consistent at ~2,000MW for the past 12 hours – which is, at the same time:
1) Down considerably (by 4,000MW-6,500MW!) compared to recent days; but also
2) Up consistently (by ~1,500MW) by where it’s been on numerous periods the past two months.
It blew a gale for ~3 days and saw a new all-time maximum
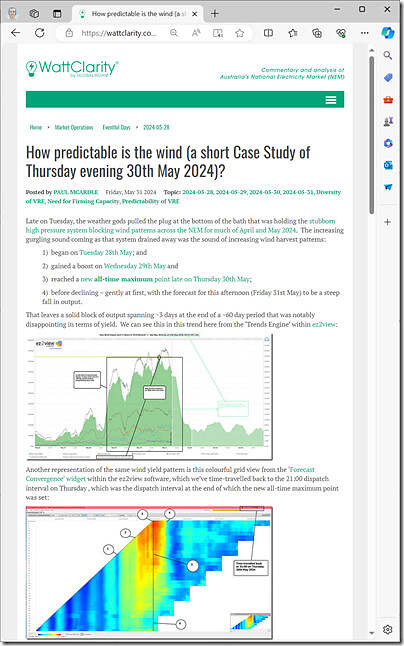
Yesterday we wrote ‘How predictable is the wind (a short Case Study of Thursday evening 30th May 2024)?’:
That’s useful to refer to for two reasons:
1) First is to highlight that the AEMO had forecast that wind yield would drop rapidly from the peaks of the past few days overnight … which is what turned out to happen (even the current level closely matches the AEMO’s forecast for UIGF)
2) But the first image in that article is also useful to illustrate that it blew a gale consistently for about 3 days:
(a) With wind yield above 6,000MW for much of that time
(b) Including a new all-time maximum point late (at 8,431MW) on Thursday evening 30th May.
But wind yield through April and May 2024 was disappointingly low
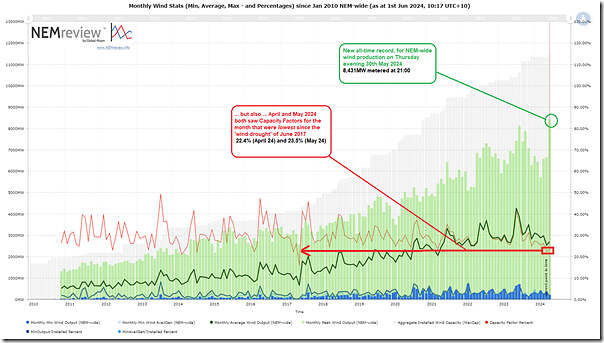
Even before that gale had started to build up (from Tuesday 28th May 2024 forwards) the past ~8 weeks had proved quite interesting, except at the other end of the scale with a consistent and long run of low wind yield across the NEM through April and May. I’d noted a number of times that I was waiting till the month of May had fully elapsed to produce an update on this long-range trend of monthly wind production statistics, and so here it is:
Those with a licence to the NEMreview software can open their own copy of this query here.
We’ve highlighted on this trend both the high point on an instantaneous basis, and the low points on an average monthly basis. With respect to the calculated capacity factor:
1) Recently:
(a) For April 2024 it calculated as 22.37%; whilst
(b) For May 2024 it calculated as 23.52% … obviously given a boost by the gale that blew for three days at the end of the month (for another article we might look at how much was that boost?)
2) We need to go all the way back to June 2017 to see a lower capacity factor:
(a) That was almost exactly 7 years ago now, back with the notorious ‘Wind Drought’.
(b) We can see in the chart above that the capacity factor was much lower then … down at 15.92%
(c) Remembering that there was much less geographical diversity of wind farms then
(d) There was also much less price-based economic curtailment back then … though I can’t be sure about network curtailment without reviewing history in more detail, as the SA region ‘system strength’ constraints used to play a much more significant role in the past (can’t immediately recall if back that far).
3) Notable mentions (in terms of seasonal lows – i.e. all points below 25%) go to the following months in between:
(a) Nov 2023 at 24.89%
(b) April 2021 at 23.66%
(c) July 2020 at 24.30%
(d) February 2020 at 24.85%
(e) April 2018 at 24.46%
So we see both April and May 2024 were worth highlighting … but especially given that they are consecutive months!
Caveats…
Of course, frequent readers will remember:
1) these complexities about measuring any power generation facilities ‘Installed Capacity’ to use as the denominator in this calculation.
2) and also how Dan Lee wrote ‘Why capacity factor is an increasingly simplistic way to compare solar farm performance’… with similar concerns relating to wind farms
A very interesting 8-9 weeks that will be analysed further, as time permits…


Leave a comment