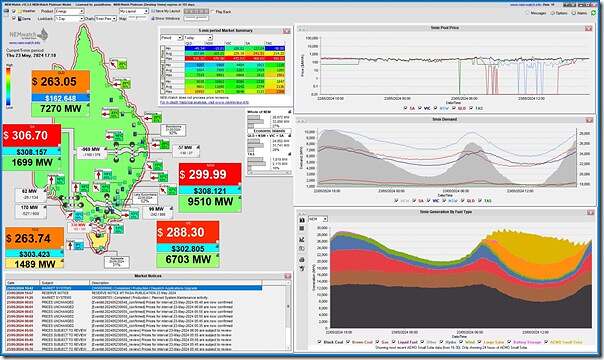
Earlier today we saw the announcement of the delay to closure of Eraring Power Station.
As the sun sets for the day, I still have a few things left on the ‘to do’ list for the day – but could not help noticing that the aggregate wind yield across the NEM has dipped to under 500MW at the same time as the sun is setting (somewhat related to one reason for the news this morning). This we see in this snapshot from NEMwatch at the 17:10 dispatch interval, NEM time:
Perhaps it’s just my selective memory, but my sense is I’ve been seeing more instances of low aggregate wind yield in May and April beforehand (including this stretch) than I ordinarily would.
… for instance at 16:20 the aggregate wind yield across all wind farms for which AEMO publishes data was 398MW (i.e. FinalMW):
(a) Which, with an installed capacity base of 11,347MW (remembering these caveats) is an instantaneous capacity factor of only 3.5%
(b) Though it should be noted that the aggregate solar yield was not zero at that point (albeit down to 3,225MW across Small and Large, remembering Medium is invisible)
A reminder to me to update these long-range stats for wind production. in the coming weeks (i.e. after we’ve seen May in its entirety). Those not so familiar with the machinations of the NEM should recall that low wind might be a result of a combination of factors:
1) Including, of course, low underlying resource for wind;
2) But also including curtailment (for network or economic reasons), as Dan illustrated here with respect to 8th May 2024 in NSW.
Nothing further, at this point.


I would be curious to know how the aggregate wind yield compares to the aggregate energy consumed in restarting the turbines during these periods and what the ‘net’ might be (if I understand the operation of these machines correctly)?
This particularly long period(s) of low wind output is significantly increasing the wholesale prices in Victoria, SA and Tasmania. It has been compounded by lower hydro output in Tasmania due to below average rainfall over the hydro catchments for around six months. A further compounding factor is the lack of solar in Victoria, both utility and behind the meter. While relative solar output at this time of the year is lower, Victoria has disproportionally lower utility and rooftop solar compared to SA, NSW and QLD. Additional solar output during these low wind events would significantly lower prices during at least some of the days.
And whilst those wind turbines are not driven by wind they become 50kw motors to prevent annealing the blade bearings