There’s much to read for those who are trying to keep tabs on the many different threads related to the energy transition (and we’re aware that WattClarity adds to that – hopefully in a positive way).
One piece that I’ve quickly skimmed recently was this Working Paper ‘Solving for y: demand shocks from Australia’s gas turbine fleet’ written by Paul Simshauser and Joel Gilmore and published by the Centre for Applied Energy Economics & Policy Research out of Griffith University:
I found it more accessible than some other papers (perhaps in part because you need to read about half-way through before confronted with mathematical formulae), and puts into words some questions I’ve had with respect to the challenges of firming in a future NEM that’s dominated by VRE.
Quoting from p2/28 we have:
‘In power system planning models with very high levels of VRE, the capacity of last resort takes on a critical role vis-à-vis power system reliability. With few exceptions, all models, and all modellers, currently rely on gas turbines to balance power system demand in a manner that meets the overarching energy policy objective function, viz. to minimise cost subject to reliability and CO2 emission constraints.
But the normative dynamic partial equilibrium frameworks that underpin all modern power system planning models necessarily forecast what needs to be done. Frequently, they are not constrained by what can be done, even if by way of ex-cathedra, but nonetheless reasonable, professional judgement. We examine outputs from 12 power system models and 10 modellers – 9 of which are anonymised, the other being Gilmore (2024). All models and all modellers signal sharp episodic increases in gas turbine plant duties. Crucially, all modellers assume, at least implicitly, a gas market that is endlessly flexible. In this sense, modellers have identified what needs to be done. And to be clear, the assumption of endlessly flexible gas markets has proven to be entirely reasoned and reasonable over the past two decades.
… there’s another author talking about how a model’s just a model (and perhaps more simplistic than a reader might assume) …
However, when we examined model results for the post-coal environment in detail, we found a surprisingly intensive role played by gas turbine plant at common points in time. The modelled output of gas turbine plant would surge in episodic periods of 5-10 days at a time during the winter months of June and July, when solar irradiation is at its lowest and east coast wind output experiences its annual nadir.’
… and onto the next page:
‘The purpose of this article is to test, ex ante, normative electricity market model assumptions by identifying the outer operating boundaries of the adjacent market for natural gas – in essence identifying what can be done, given known market conditions. We do so by relying on a nodal model of the Australian east coast gas market – the same model which predicted the 2018 gas market shortfalls.
To summarise our results, gas turbine output during low renewable energy periods associated with winter months appears to be incompatible with the outer operating limits of Australia’s eastern gas market functionality as we currently understand it. If there is any upside to our analysis, it is that sufficient time exists to reconcile otherwise intractable gas turbine dispatch duties with electricity and gas industry capacity. ’
A large amount of firming required, but not very frequently
Reading through the report, I see a consistent theme – this new NEM that we’re approaching looks set to require a very large amount of firming capacity installed on the ground, and charged ready to go … but much of it’s not going to be used all that often.
1) That is, for instance, the same high-level conclusion we came to in our ‘Exploring Wind Diversity’ study included as Appendix 27 within GenInsights21;
2) It’s just that in this paper the authors look at supplying that firming from gas-fired generation rather than other types of stored-energy assets.
Unfortunately it seems too many people can’t see past the low annual averages quoted in summaries of modelled results … as we’ve written before (such as here), the NEM is becoming a market/system where the averages are less and less dominant, and the extremes increasingly matter.
How will that Firming Capacity be supported (in development, and operations)?
The authors ask very necessary questions about whether the right structures are in place to provide support for this very large amount of insurance product that we’ll inevitably require. For instance, here’s some highlights from section 5.1 on p17 and p18 as follows:
‘In the ‘no new pumped hydro scenario’, annual gas used by the gas turbine fleet equates to ~194 PJ/a. Prima facie, there is nothing spectacular about 194 PJ of gas use in a single year – it sits neatly within the bounds of historic gas generation outcomes as illustrated in Figure 3 (i.e. recall the historic range from 2009-2023 was 93-212 PJ/a). However, this scenario exhibits as much as ~3000TJ/d of gas demand from gas turbines alone during critical event days on a NEM-wide basis (cf. 1100TJ/d historically).
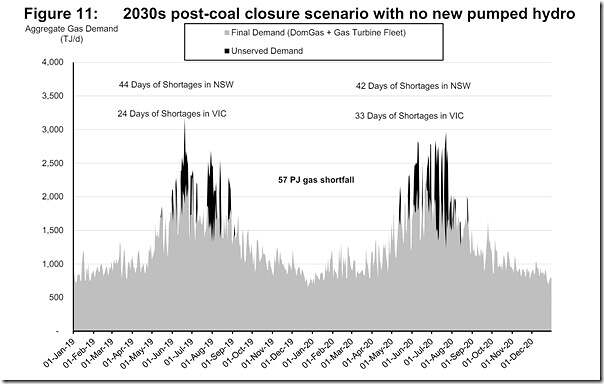
Due to the diurnal and seasonal pattern of renewables, limited storage capacity of (4-hour) batteries (which were uneconomic to provide reserve energy for infrequent events) and no new pumped hydros being developed beyond Snowy 2.0 and Kidston, aggregate storages in the power system and the gas market are quickly and routinely exhausted early in the winter months. This scenario is unique, and not contemplated by other modellers or the Market Operator in its annual Integrated System Plan (AEMO includes ~8GW of pumped hydro in its forecasts). GPE Model results for the east Australian gas market for this scenario are illustrated in Figure 11.
In Figure 11, the first point to note is that ‘Final Demand’ is represented by the light shaded grey area and represents the combined ‘demand served’ for DomGas and the Gas Turbine Fleet. Conversely, ‘Unserved Demand’, depicted by the dark-shaded area, represents that component of gas turbine demand for natural gas which exceeds modelled system capacity.
Figure 11: 2030s post-coal closure scenario with no new pumped hydro
In Figure 11, unserved gas demand is very extensive. In aggregate across the two-year window, shortfalls equate to 57 PJ (26 PJ in year 1, 31 PJ in year 2). NSW is forecast to experience more than 40 critical events per annum, and somewhat unexpectedly, Victoria is forecast to experience more than 20 days of shortfalls per annum as well. It is to be noted that we have excluded event days in which demand shortfalls were less than 100TJ/d – our thinking being gas linepack would adequately resolve these. If <100TJ event days are included, NSW critical event days rise to ~55 per annum. ’
Our own questions … and those of Large Energy Users
We’ve also been asking similar questions:
1) We wrote almost exactly a year ago that ‘We’re not building enough replacement dispatchable (i.e. firming) capacity’.
2) And I’ve also written about my disappointment that a much touted expansion to the original Capacity Investment Mechanism smelt too much like ‘bait and switch’ as the scheme was padded out by a very large increase in support for VRE, but only a very modest increase in the level of support for the firming capacity we’re bound to need.
Coincidentally this week, I’ll be at the EUAA Annual Conference in Melbourne (Wed 1st and Thu 2nd May 2024), where long-running concerns about the immature approach to Australia’s energy transition are sure to be a prime topic for conversation.
Looking forward to the discussion there!


Why wouldn’t the turbines switch to liquids when the gas system gets tight as has always happened?
There are many challenges ahead. Have any of these predictions taken into account the steady rise in EV car charging during the night when the system will only be able to use gas for the expected “firming ” periods?
In the précis above, it is interesting to note the Abstract referring to “low-cost intermittent wind and solar resources”.
This “low-cost” claim is highly disputable. For instance, at the outset, the cost of a renewables based system must include the cost of all the required firming or back-up needed to make such a system work. In effect this amounts to building two independent generating systems – each capable of maintaining the system when the other isn’t.
Furthermore the renewables option must include the full cost of building and maintaining a vast web of new transmission lines needed for the express purpose of collecting the outputs from a huge number of generating units.
Note that these new lines collect electricity rather than distribute it, and they also inefficiently lay idle for much of the time.
Then there is the reality that short life renewables require perpetual rebuilding at unknown expense. Even the replacement of thousands upon thousands of worn out turbine blades presents as a huge expense item.
The gas based back-up generation system will produce a high level of emissions, perhaps far greater than anticipated.
However, the worst aspect of this discussion is the absence of any reference to the emissions free nuclear option.
A large, inflexible coal fleet in the presence of rapidly rising intermittent renewables can be
expected to confront a rising number of negative price events (Nelson et al., 2022)… prices fall to negative levels with solar plant capable of producing to the negative of ‘renewable certificate prices’, and rooftop solar exports being indifferent to wholesale clearing prices.”
The model seems to include an assumption that REC’s will be with us for ever, along with increasing negative price intervals and cost pressure on retail tariffs. Since VRE is often touted as the cheapest generation, why not do away with REC’s immediately, if not sooner? That would reduce market volatility and energy cost to the often poorest members of society customers.
Thanks for sharing, Paul.
This statement is made in the concluding remarks section: “Detailed analysis of demand side reductions and the impact of electrification was not considered in this study.” Given the potential scale of household batteries and other demand side resources, I’d be keen to understand their impact on the modelling outcomes.
I believe the context here is gas network demand-side reductions (hence the mention of electrification, which will reduce domgas demand). It’s clear from this that heavy reliance on gas peakers is going to require either an increase in the storage capacity of the gas network, gas demand-side reductions, or more probably both in some measure.
To my mind, this should add some urgency to the gas-to-electricity household transition.
Conversion of open cycle gas plants to combined cycle should be part of the Capacity Mechanism as it enables 50% more electrical energy from the same amount of gas. As batteries are displace open cycle gas peaking plants for the morning and evening peaks, the new role for gas will be for high efficiency gas plants operating continously for several days at a time during wind droughts. Their lower marginal cost will enable them to cost-effectively charge peaking batteries at night and during solar hours. As an example, Mortlake Power Station was designed for upgrading to combined cycle. It is one of Australia’s newest gas power stations, and has its own gas pipeline to the Iona storage facility, so is exempt from the pipeline constraints described in the paper. Conversion of more gas generators to combined cycle could well overcome nearly all the gas capacity contraints outlined in the paper.