
I’ve come across articles on RenewEconomy and PV Magazine this morning reporting that ASX-listed Genex Power minority shareholder J-Power has put in a $380m takeover bid for the company.
As of lunchtime today:
- I see the share market has priced in the news with a 32.4% increase since previous trading day to 24c/share – which is just a touch below the 27.5c/share which J-Power will reportedly offer.
- I also saw this ASX Announcement ‘Genex receives non-binding, indicative and conditional proposal from J-Power’ from earlier today.
In light of this news, and the release of their half-year results approximately one week ago, I thought this would be a good chance to examine the market performance of the company’s three operating assets (four DUIDs) through our recently released GSD2023.

Genex is listed as the owner of these four DUIDs currently operating in the NEM.
Source: GSD2023
The company also has four other projects in the development pipeline in: the Kidston 2 Solar Project (250MW), the Kidston Wind Project (258MW), Kidston Pumped Hydro (250MW/2,000MWh), and the Bulli Creek Solar and BESS (Up to 2GW).
Market performance of operating assets
Jemalong SF operates on a fully or near-fully merchant basis whilst Kidston SF is thought to be more protected against low prices through their 20-year offtake agreement with the Queensland government. The Bouldercombe BESS meanwhile has an 8-year offtake agreement with Tesla who provide a revenue floor, and upside is shared at a fixed rate between the two parties.
Below we can see the market revenue totals of these four DUIDS broken into Energy, FCAS Regulation, FCAS Raise Contingency, and FCAS Lower Contingency.
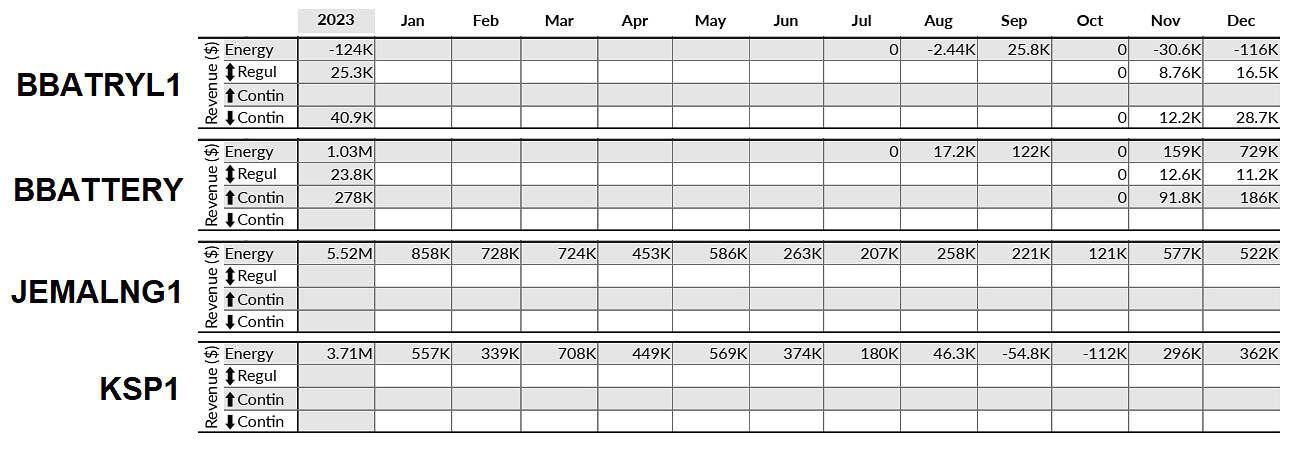
Throghout 2023, Jemalong SF delivered the highest share of market revenue for the company’s portfolio.
Source: GSD2023
The Bouldercombe BESS only began operating in the market around July/August 2023 and does not look like it ramped up to full or near-full production until the end the calendar year. From this table, we can see that the battery (net of its generation and load DUIDs) generated more spot revenue than either solar farm for the month of December.
Focusing in on the two solar farms, in the chart below we can see each unit’s price capture relative to the regional reference price. The charts on the left show production (dark purple), availability (light purple), and unavailability (white) volumes for each time when the energy spot price fell within those defined bands. The chart on the right shows the same data but expressed as capacity factor (dark purple), availability factor (light purple) and unavailability factor (white).
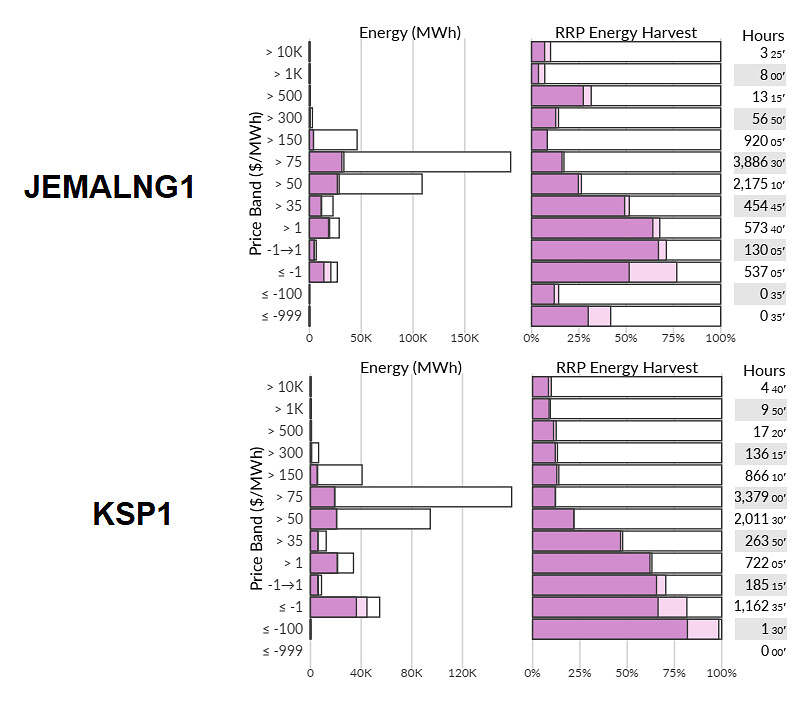
In 2023, Kidston Solar Farm faced (and harvested) a higher volume of negative prices than Jemalong.
Source: GSD2023
In the case of Jemalong SF, it is worth noting how these charts compare to 2022. Roughly one year ago I posted an article that contained the same chart for Jemalong’s price capture from our then-current GSD (the 2022 edition). The charts show a similar shape in terms of price capture, but notable is the much higher incidence of negative prices in the unit’s region – in 2022 there were 245 hours and 5 minutes when prices were below -$1/MWh, compared to 538 hours and 15 minutes in 2023.
For Kidston (located in the QLD region) this feature was even more extreme with 1,164 hours and 5 minutes where prices were below -$1/MWh.
Leave a comment