
This afternoon marked the release of the 2022 edition of our Generator Statistical Digest (the GSD2022).
Fortuitously for me, only a couple hours after its release I came across Giles Parkinson’s article for RenewEconomy “Solar farm revenue slumps as market cools in aftermath of coal and gas crisis”. Giles’ article provided me with a perfect opportunity to take a deeper look into the summarised numbers that Genex published in its Q4 earnings report.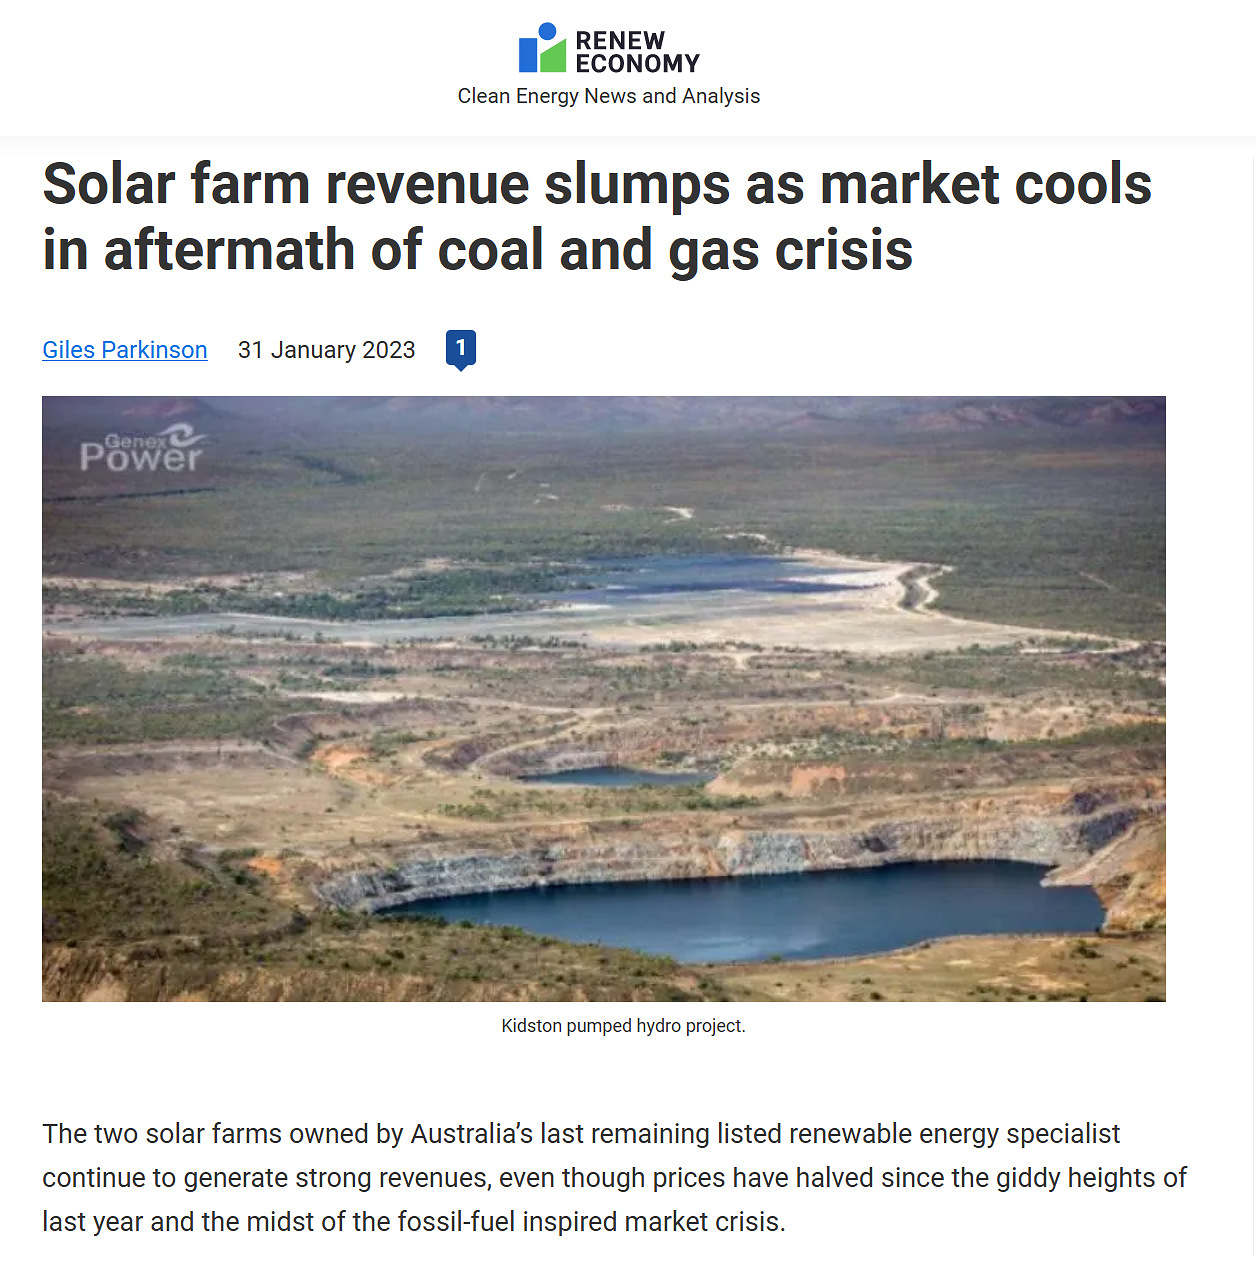 Through looking at an ASX announcement from the publicly-listed company, Giles reports that Genex Power’s two merchant solar farms (the 50MW Jemalong Solar Farm and the 50MW Kidston Solar Farm) saw revenue slumps from Q3 to Q4 as spot prices cooled off.
In his article, Giles wrote:
“In the December quarter, Genex says revenues at Jemalong (including large scale generation certificates) averaged $112/MWh, down from an average price of $180/MWh in the September quarter and $214/MWh in the June quarter.”
With a hot-off-the-press copy of our GSD2022 in front of me, I thought it was worth having a quick look into the performance of one of those solar farms to gain some context about those reported figures.
Image 1: The performance profile of Jemalong Solar Farm throughout 2022 with average prices, revenue, and price band harvest highlighted.
Source: GSD2022
The image above shows the B page for Jemalong Solar Farm from our Generator Statistical Digest 2022.
In Figure 1 we can see that the VWA (Volume-Weighted Average) price that the solar farm received from October to December was $104/MWh, $75/MWh and $43/MWh respectively – and zooming back out we can see how these monthly VWA prices for the unit trended down since a high of $303/MWh in June 2022.
Through company announcements, Giles reports that the solar farm averaged $112/MWh through Q4 when accounting for LGC certificate revenue. Comparing this figure to the VWA prices for the unit may provide a roundabout, but very rough, indication of the average MWh value of LGC revenue that the solar farm was able to generate throughout the quarter. The chart below uses Green Energy Market’s data to demonstrate the spot value of LGC certificates over the same period of time.
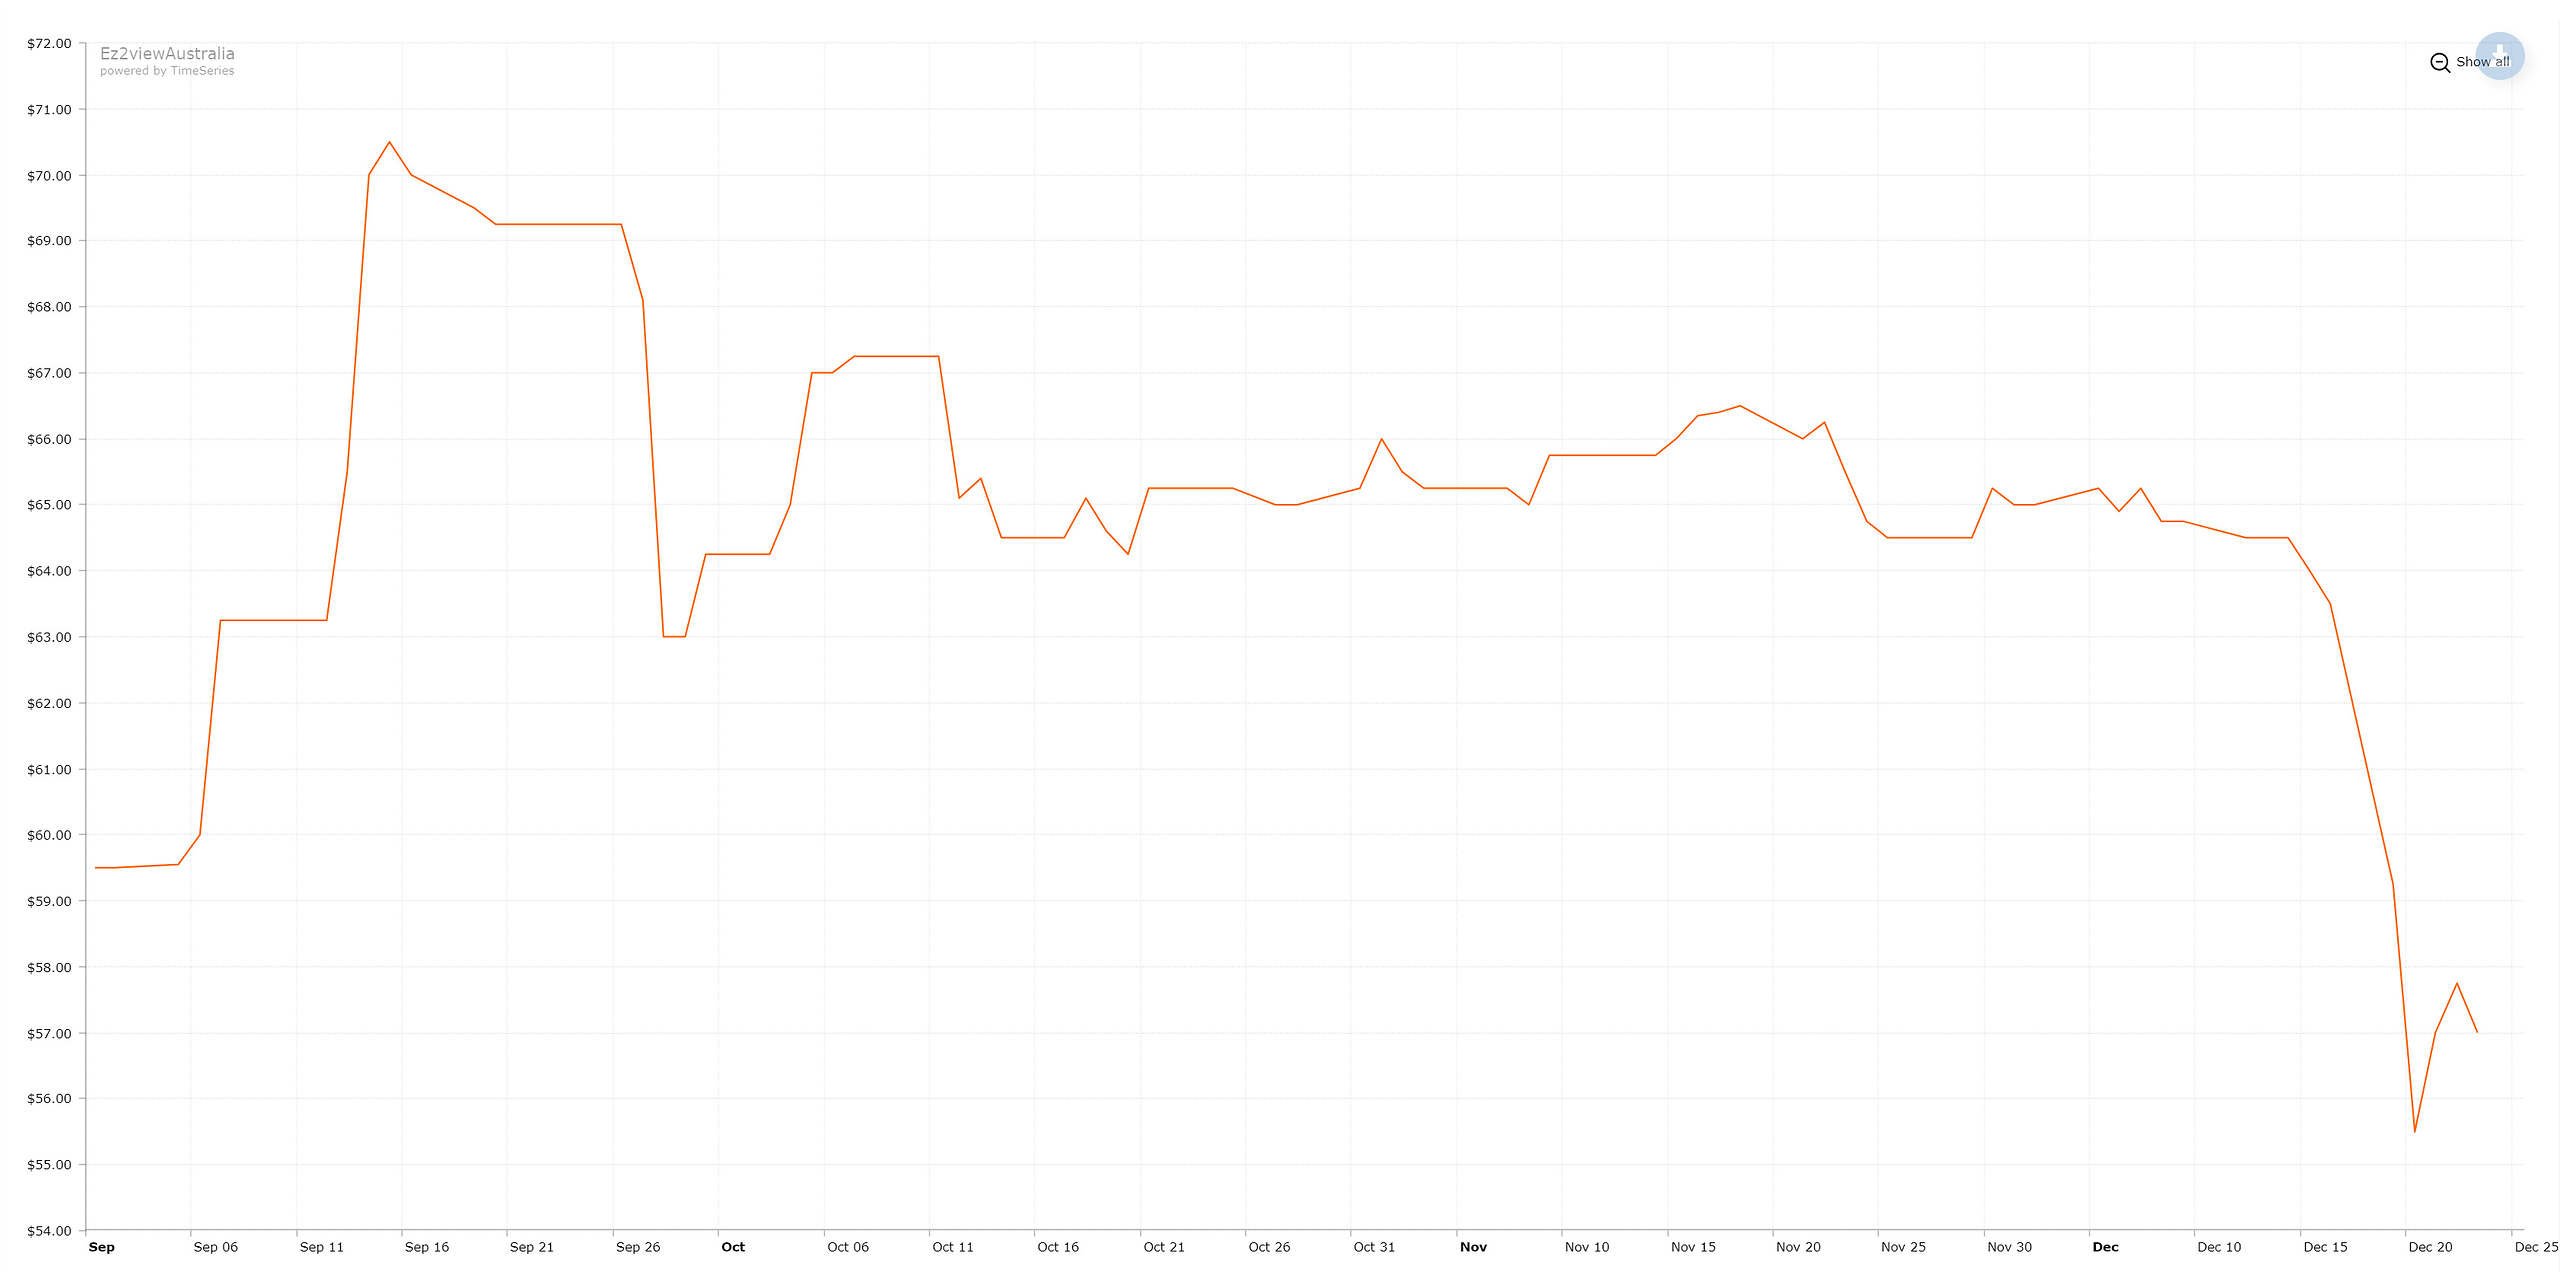
Image 2: LGC Spot Price throughout Q4 2022
Source: Green Energy Markets via ez2view Trend Editor
From totaling the revenue numbers in Figure 1 we can see that Jemalong generated $1.87m in spot market revenue only through Q4.
Figure 2 in Image 1 is a 100% horizontal stacked bar chart that shows the RRP (Regional Reference Price) Energy Harvest of the solar farm throughout last year. Essentially, this chart provides an indication of the price band performance with dark purple indicating the unit’s output relative to % of time when the RRP was in the corresponding price band, and light purple indicating the same but for the unit’s availability.
Figure 2 is useful for examing how effective Jemalong was at avoiding negative spot prices throughout 2022. From the RRP energy harvest chart we can see that Jemalong was generating around 30% of the time when the NSW spot price was less than -$999.00, and that it was generating nearly 50% of that prices were in the -$100.00 to -$999.00 price band.
Leave a comment