
For the past four years, Green Energy Markets has produced projections of solar PV and stationary battery system installations for the Australian Energy Market Operator. These are used to help inform AEMO’s Integrated System Plan and Statement of Opportunities planning exercises for both the NEM and the Western Australian SWIS.
In December we completed our most recent projections which landed on some quite staggering numbers for the amount of cumulative solar and battery capacity we’ll have installed on rooftops across households and businesses. The chart below details the amount of cumulative degraded solar PV capacity we projected in the NEM states for residential and commercial systems sized below 100 kilowatts for the three scenarios AEMO has selected for the coming year’s planning documents.
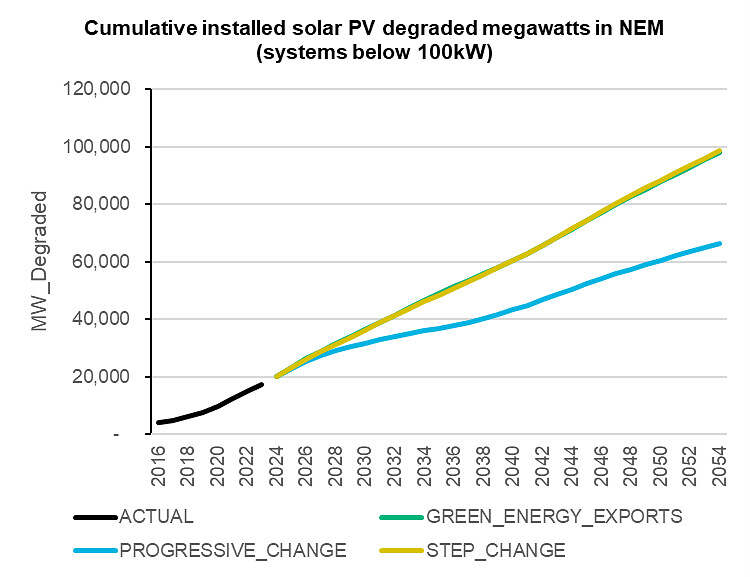
Under the most pessimistic scenario of Progressive Change, we still landed on a very large amount of capacity by 2053/54 of around 66,000MW. Under the two scenarios where governments in Australia and also globally are assumed to step up to make concerted efforts to contain global warming below 2 degrees – Step Change and Green Energy Exports – we reach a similar level of around 98,000MW. However, it should be noted that the higher level of capacity under these scenarios is based on an assumption of significant additional new government policies not yet implemented.
These are staggering levels of capacity because they go well beyond the levels of installed capacity in the NEM we have now for coal, gas, and hydropower plants combined of around 41,000MW, and also well above typical historical daily averages in electricity demand.
It should be noted that these are Green Energy Market’s own projections, but AEMO will also make use of projections prepared by CSIRO. Based on AEMO’s most recent draft assumptions released in December they have proposed using our projection for the Green Energy Exports scenario while using CSIRO’s for Progressive Change and a blend of CSIRO and our own projections for the Step Change Scenario. CSIRO’s Progressive Change projection used by AEMO still ends up with a very large amount of rooftop solar capacity by 2053-54 at 48,000MW, even if it is substantially lower than our own estimate for this scenario. In terms of Step Change, AEMO’s blended projection has around 92,000MW by 2053-54, which is not too far off our projection of a bit above 98,500MW. So, no matter which way we cut this, these forecasts indicate we are headed for an amount of rooftop solar capacity (taking into account panel degradation) that is close to, or greater than typical average electricity demand. Then on top of this we also have solar capacity in solar farms and large commercial installations above 100 kilowatts per system which is in addition to what we’ll cover in this note.
For many such a large amount of rooftop solar capacity seems to stretch the boundaries of credibility. Why would we install more rooftop solar capacity than typical total electricity demand across not just residential customers but every sector of the economy? The first response is that rooftop solar systems in aggregate for most of the daytime hours will produce an amount of electricity less than 50% of their rated panel capacity, so it isn’t as big an amount of capacity in reality, as it is on paper. Yet even now, in both the NEM and the WA’s south-west grid we regularly experience periods where wholesale electricity prices go to negative levels during daytime periods as other power generators struggle and fight to remain online in the face of a flood of rooftop solar generation. If that’s the case with about 20,000MW of rooftop solar capacity in the NEM then imagine what things will look like with 48,000MW to potentially even 98,000MW.
We’ve thought long and hard about whether such large amounts of rooftop solar capacity are realistic. We must admit that after adjusting and updating all the various assumptions and then letting the model run, we were surprised to see the large size of capacity the model landed on at the end of the projection period. Stakeholders have provided us with a range of very thoughtful and sensible feedback over the years which has given us pause for thought about these results.
In considering this feedback and questioning the results there are four fundamental and relatively simple and logical reasons for why we expect that cumulative solar capacity will continue to grow to the kind of levels our model projects.
1) Solar systems last a long time and their capacity steadily accumulates
The first point to keep in mind is that these cumulative capacity numbers do not reflect a bullish view of the solar market that is continuously luring a growing number of new customers to install a solar system every year. In fact they reflect the opposite – we expect the number of solar systems being installed (after deducting system retirements) to decline across all scenarios relative to levels achieved in recent years, as shown in the chart below.
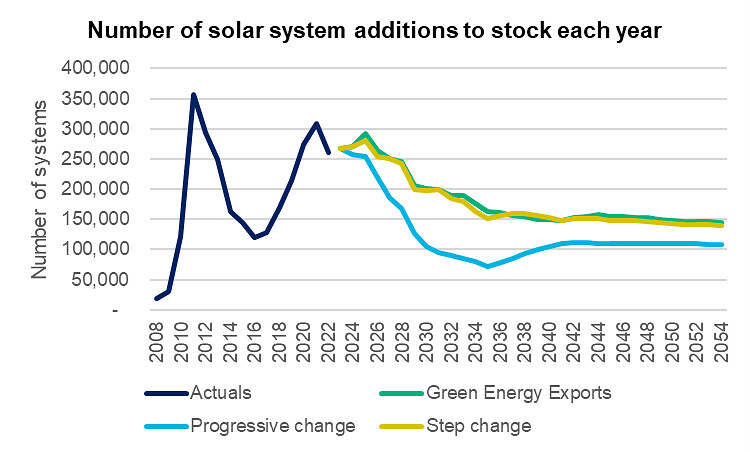
However, the thing is that solar panels last a long time. They can still function very well after 20 years. So each year’s addition of capacity can build and build upon prior years before retirements become a significant negative factor. Plus, we expect that most systems when they reach their end of life will be replaced with a new system, because a new solar system per kilowatt will be cheaper than the original system bought by the homeowner, and so is likely to be perceived as good value. So, we end up with a steady accumulation of more and more capacity, even though overall the number of new sites installing solar each year is expected to decline substantially from what we’ve experienced in the last few years.
In addition, because Australia’s population is expected to continue to grow, we are adding around 200,000 new dwellings each year (of which roughly half are detached or semi-detached) which increases the available market for incremental new system additions.
2) Curtailment has minimal impact on the economics of a solar system once it is coupled to a battery.
Given how large solar capacity grows relative to total electricity demand, a range of stakeholders have understandably highlighted to us that solar generation will have to be increasingly curtailed and its value in the wholesale electricity market, and therefore feed-in tariffs, will decline to very low levels.
The interesting thing we found is that over the next decade, the impact on the economics of household solar systems from curtailment becomes so small that it can almost be ignored (provided curtailment is limited only to generation that would otherwise be exported to the grid).
Don’t get us wrong, there is little doubt that the value of solar generation in the wholesale electricity market is on a rapidly declining trajectory which is leading to declining feed-in tariffs and the revenue a household can earn from exporting power. This is one of the reasons why we expect the annual number of solar system additions will decline relative to recent years. However, this also means that in the future if a solar system’s exported generation is increasingly curtailed, it has relatively little financial impact because exports receive so little revenue.
The key caveat to this finding though is that it is heavily contingent on an assumption that home battery storage systems will decline dramatically in price over the next decade and become a standard part of a new solar system install.
To help explain this resilience we first need to understand what happens with the physical output of the solar system. At present without a battery our archetype customer exports around two-thirds of the solar output. Based on average feed-in tariffs prevailing in the year 2020, using NSW as an example, that returned around $600 per year to a householder with an average-sized system of around 6.6 kilowatts, while the rest of the solar generation that was consumed on-site avoided grid imports with an annual value of $730. So, feed-in tariffs have historically been very important to the value of solar.
But by 2030 we expect feed-in tariffs will have fallen to very low levels. If the system owner doesn’t invest in a battery the exported generation will fall in value to $440 per year and by 2035 it will be worth just $320 under the Step Change scenario. The output self-consumed on-site is also expected to plummet in value to $410 by 2035 due to the roll-out of time-of-use tariffs that provide discounted power from 9am until 3pm (but which also charge a hefty premium during the 3pm to 9pm peak demand period).
Once a battery is coupled to the solar system it soaks up almost half of the generation that would otherwise be exported to the grid. The chart below shows for a 6.6-kilowatt solar system with a 10-kilowatt-hour battery we end up with solar generation being roughly divided up into thirds across immediate consumption on site, charging up the battery, or being exported to the grid.
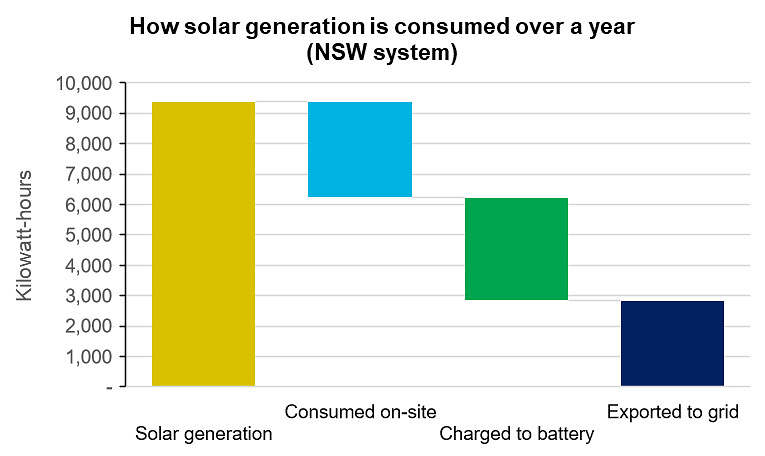
Source: Green Energy Markets Solar + Battery Market Model
So the physical quantity of kilowatt-hours of exports being exported to the grid has been substantially reduced, but it’s the financial value that really seals it. The chart below details that under the Step Change scenario by 2035 exports to the grid deliver just $100 of benefit to a household per year if they were unconstrained and represent just 7% of the overall revenue derived from the solar system’s generation. So even if the 50% of the exported generation was curtailed the household has only lost 3.5% of the overall financial value from the solar generation.
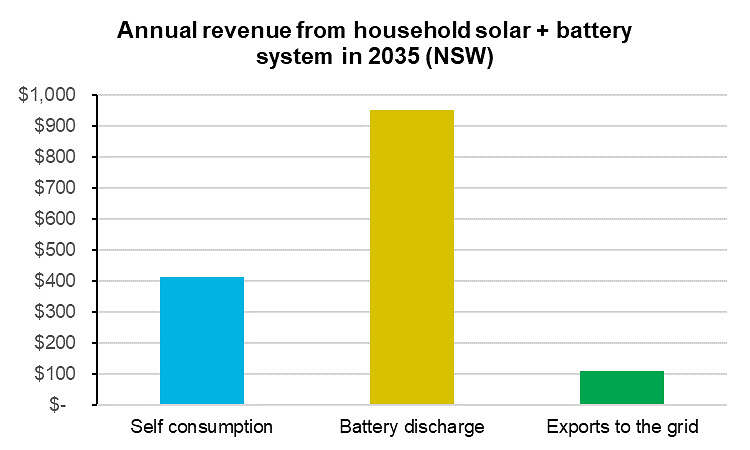
Source: Green Energy Markets Solar + Battery Market Model
This leads us to the conclusion that the solar market is likely to remain resilient in the face of an environment where AEMO and/or distribution networks need to intervene to curtail solar exports to the grid.
As mentioned previously the big caveat to this analysis is that it assumes significant reductions in household battery storage system prices, with an expectation they will halve between now and the 2030 to 2035 period. This is an area of significant uncertainty but is informed by two macro-drivers:
- The motor vehicle market’s shift to battery electric drivetrains is likely to lead to substantial improvements in battery technology and economics driven by huge economies of scale that can support intensive research and development and learning by doing.
- Energy storage is based on highly modular battery cell technology which means household battery systems through mass manufacture can largely bridge the gap in price we currently see with utility-scale energy storage systems.
3) Distribution networks have demonstrated a capability to manage very high levels of household solar adoption
There is a common belief we come across from people who work outside of the electricity network companies, that distribution networks are close to a bursting point with the amount of solar PV they can accommodate within their networks. These are usually described in qualitative terms as emerging “solar traffic jams”. But when you ask for specific quantitative, physical evidence of network limitations very little is forthcoming. It doesn’t help that distribution networks outside of Victoria have lacked access to smart meter data that could give them a good line of sight on what is happening with voltage downstream of their low-voltage transformers.
The best evidence we have been able to find examining the prevalence of these so-called solar traffic jams (which should really be described as excessively high voltage) has come from:
- the Victorian Government’s Voltage Management in Distribution Networks review process through making use of their smart meter data; and
- Research published by the University of NSW’s Collaboration on Energy and Environmental Markets using data gathered by Solar Analytics devices.
This information suggests that solar system curtailment due to excessive voltage is relatively minor at present and there is scope to better manage voltage at modest cost to integrate additional solar capacity. In addition, in the future once batteries become attractively priced and widespread, this will substantially mitigate the voltage rise created by solar.
The interesting thing is that when you examine data on the proportion of households with solar by postcode in Australia, you find that distribution networks are already managing to handle geographic areas with very high concentrations of solar system adoption. The chart below cross-references the population by postcode against the proportion of households with solar within each postcode. Already 5 million Australians live in postcodes where 50% or more of households have a solar PV system. Postcodes with a combined population of around 750,000 have 70% of households or more with a solar system.
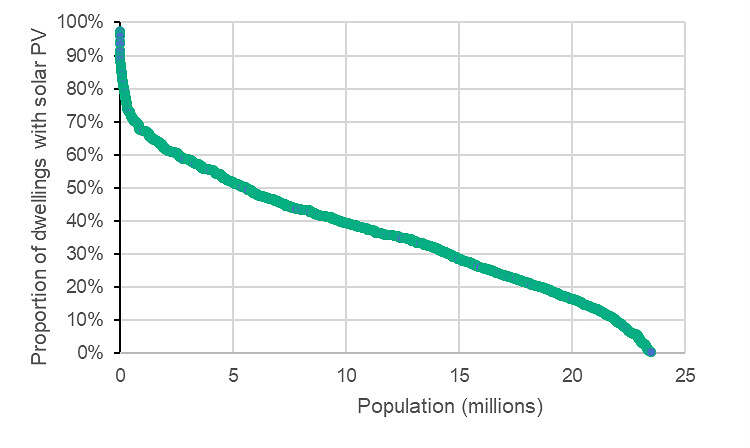
Proportion of households with solar by postcode relative to population
While distribution networks vary in their physical characteristics across different locations that means not all areas are readily equipped to handle such high levels of penetration, this suggests scope for far more growth in solar adoption.
4) The capacity of the typical household solar system is steadily and inexorably growing
In 2021 Australia installed a record amount of STC-registered rooftop solar capacity at 3,192MW. This was 380% greater than the capacity installed ten years previously. But what is often not appreciated is that the number of individual solar systems installed was up by less than 5% compared to 2011 levels. The dominant driver of growth in capacity was not more households and businesses installing solar but rather that they had been persuaded to buy bigger systems, particularly in the residential sector. The chart below illustrates how the residential solar market has been progressively shifting to systems of larger and larger capacity over time. Back at the beginning of 2010, almost 70% of solar systems were less than 1.5 kilowatts in size. By 2019 the market had become dominated by systems between 6 and 7 kilowatts. Yet over 2023 we saw even systems up to 7kW in size falling to less than half the residential market.
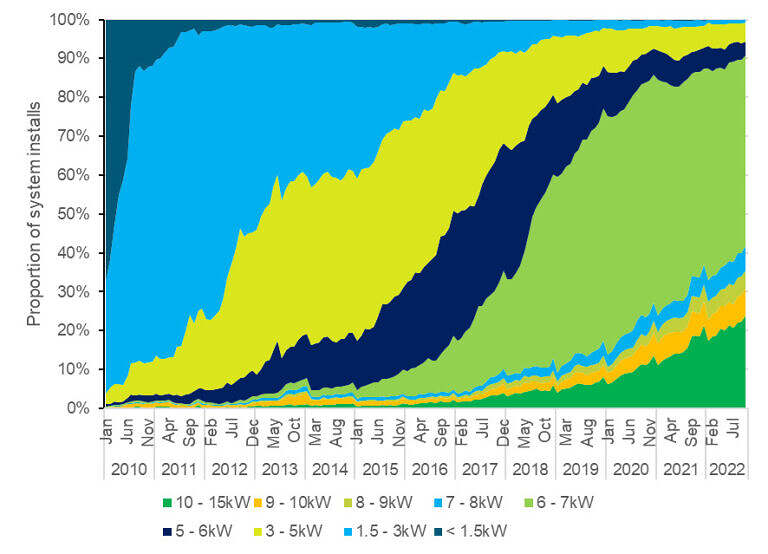
Proportion of residential solar systems within different capacity size bands
Source: Green Energy Markets Solar Report subscription product
We expect that this ongoing growth in system sizes will ultimately slow due to a range of reasons including:
- the scale-back in the Federal Government’s STC rebate per unit of capacity;
- falling feed-in tariffs and increasing curtailment;
- an expected slowing in panel conversion efficiency improvement; and
- household rooftop physical size limitations.
But while it might slow, the solar industry is clearly very motivated and very capable of upselling customers to bigger systems. Therefore, we find it hard to believe this won’t continue as modules continue to fall in price per watt. The chart below details our expectation of how the average residential system size will grow over the next few decades. This growth in system size helps to offset what we expect will be a decline in the number of new system additions, such that capacity additions are similar to, or exceed historical peaks under the Step Change and Green Energy Export scenarios. Meanwhile, under Progressive Change capacity additions remain at levels similar to those achieved between 2018 and 2019.
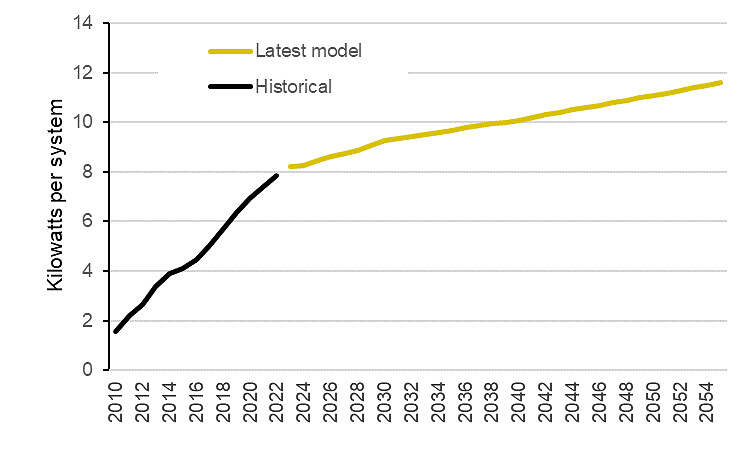
Average size of a new residential solar system by installation year
But will rooftop solar and batteries grow as fast as we need them to?
While this paper explains that rooftop solar capacity is likely to accumulate over time to reach levels that dominate the electricity market, it doesn’t mean it will necessarily grow at the speed governments ideally need it to in order to achieve their emission reduction goals. Given the long lead times we are currently confronting with the build out of large utility-scale renewable energy projects, rooftop solar – which will need to be coupled with batteries – becomes especially important in helping Governments maintain progress towards their emission reduction goals. However, it is very far from given that we will follow the Step Change or Green Energy Export trajectory of growth. Stakeholders need to recognize that these scenarios are intended to represent a very large scale-up in the rate of emission reduction effort in this country. Our own modelling has assumed a range of new government policies would be introduced, which we are yet to actually see implemented.
While we have seen a large scale up in support for large scale renewable energy projects via the Capacity Investment Scheme, the main support mechanism for rooftop solar (the Small Scale Renewable Energy Scheme) is on track to be steadily phased out over the next few years. In terms of household energy storage we have gone backwards with both the Victorian and South Australian governments cancelling their rebate programs. Batteries will eventually become an attractive financial proposition for households. But this probably won’t be until the 2030’s, unless we see a level of government support for batteries similar to what was provided to the solar sector in its formative period.
Rooftop solar, if it is increasingly coupled with battery storage, could be a very valuable tool in decarbonizing our electricity sector rapidly and importantly, also injecting greater competition into the electricity market and lowering household energy costs. But we also perceive a risk that is seen by some policy makers as an uncontrollable, nuisance weed, whose growth needs to be curtailed.
We certainly need to be more thoughtful about how we roll-out solar and the importance of coupling it with batteries and other demand management tools. But it could be so much more useful than an uncontrollable, proliferating weed if we introduced new policies to help roll-out technologies that can shift electricity demand to make better use of solar.
This article was originally posted on LinkedIn, and has been republished here with permission.
About our Guest Author
 |
Tristan Edis is the Director of Analysis and Advisory at Green Energy Markets. Green Energy Markets provides analysis and advice to assist clients make better informed investment, trading and policy decisions in energy and carbon abatement markets.
You can find Tristan on LinkedIn here. |
Tristan,
You discussed curtailment but did not take into account the period of Dunkelflaute.
Batteries will not provide power for periods of weeks or months. It requires pumped hydro. Even Snowy 2.0 will only provide 2GW and then only for a week.
Boston 2022* paper showed that during Winter 2010 there would have been significant blackouts, even with 10xSnowy2.0 for storage.
It also showed massive curtailment.
Other analyses I have seen like this start in July 2010 or 2011, but this paper shows peak plants (or massive batteries) could be on standby for 10-15 years.
Ref: https://iopscience.iop.org/article/10.1088/2515-7620/ac5677*Bongers discussion in Wattclarity:
https://wattclarity.com.au/articles/2022/06/seasons-of-low-wind-and-solar-output-will-influence-the-shape-of-the-nem/