Given that I’d written about earlier forecasts (i.e. at 13:50 Sunday 4th then on at 14:10 on Monday 5th) for ‘Market Demand’ up around 13,000MW in NSW on Monday evening it’s worth a brief recap.
Price Volatility
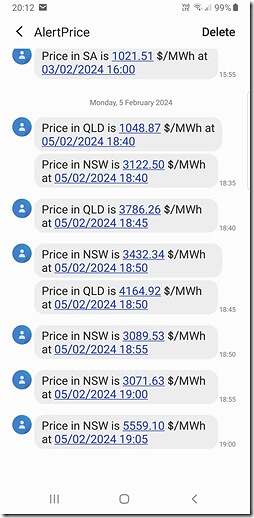
Firstly, a quick record of some volatility that evening captured in SMS alerts (triggered via ez2view – though NEMwatch and deSide can also facilitate this) … though not as extreme as earlier forecasts that even made the mainstream media:
NSW demand results
In terms of ‘Market Demand’ in NSW, the high point reached yesterday (12,245MW at the 16:40 dispatch interval – NEM time) was considerably lower than the earlier forecasts – such as those mentioned above.
Not the highest so far this summer
At this level, it was certainly not the highest point for NSW demand this summer.
1) Contrary to earlier predictions, it was lower than the level of ‘Market Demand’ seen in NSW on Sunday 4th February, when NEM-wide demand was the highest it’s been thus far in summer 2023-24 (i.e. 12,295MW at 17:40).
2) Scanning back through time, I see Sunday 21st January 2024 also saw higher demand in NSW (the NEMwatch image here was from 18:10 with NSW at 12,495MW, which was the highest point on the day) .
3) Indeed, back on Thursday 14th December 2023 at 17:55 the same measure of demand reached 13,053MW:
(a) a day captured in a few articles collated here.
(b) this was the highest point this far for summer 2023-24 in NSW.
Lower than earlier P30 predispatch forecasts
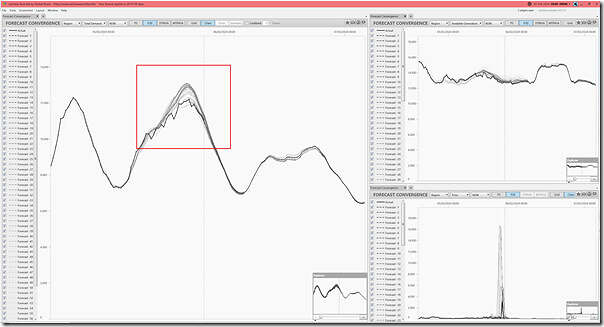
Adding in this collage of 3 x ‘Forecast Convergence’ widgets in an ez2view window time-travelled to 20:00 (NEM time) shows ow the earlier P30 predispatch forecasts turned out to be higher than what actually unfolded.
I don’t have time to explore why (e.g. cool change, or other?).
That’s all for now …


Be the first to comment on "Brief recap of NSW on Monday 5th February 2024"