Yesterday’s hot and muggy weather saw QLD’s peak market demand land at 11,036MW in the late afternoon. That mark overshot the previous daily maximum by 875 MW – that’s an 8.61% increase on a record that was set just three days earlier.
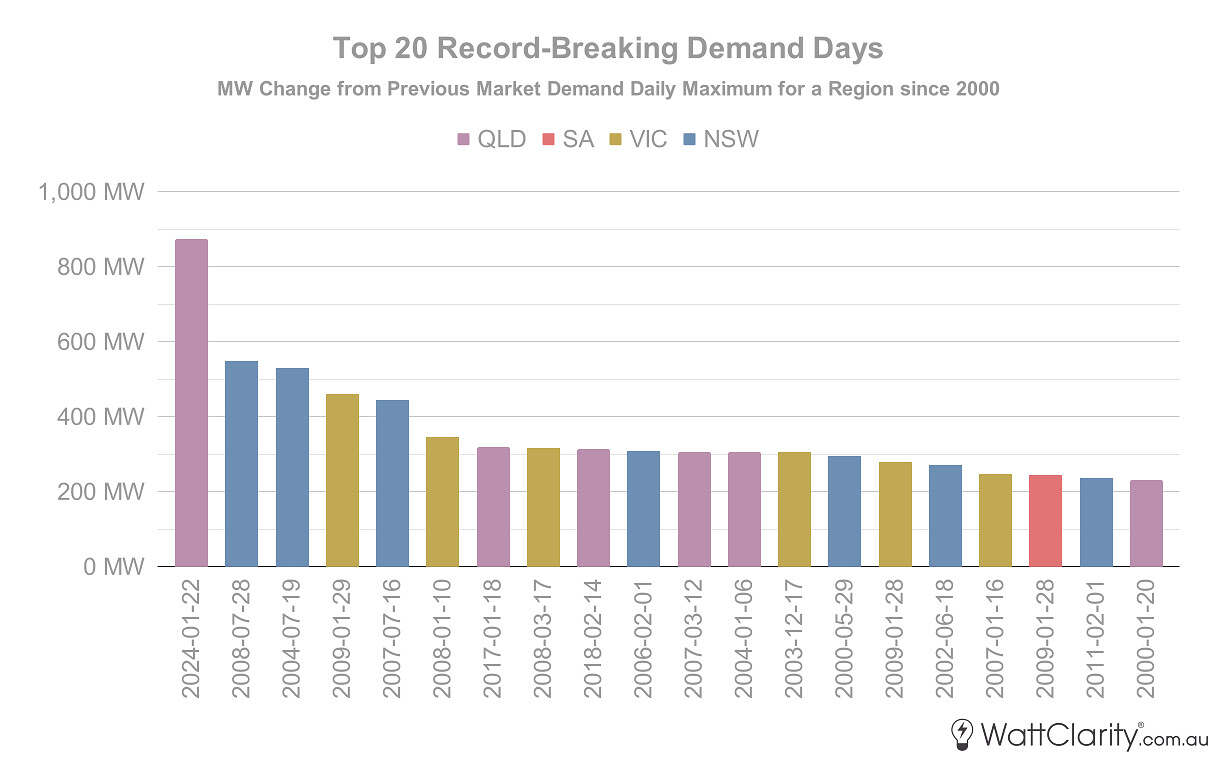
To put that into context, yesterday was the largest amount that this figure has been broken by in the past 24 years of the NEM. Below I’ve charted the top 20 occurrences of a new daily maximum regional market demand record, ranked by the absolute increase from the previous record.

By looking at the chart you should immediately notice that there is a large gap comparing yesterday’s events in QLD, in absolute terms (i.e. megawatts), to the next closest day. There is also a significant gap in recency – with yesterday being the only entry in this ‘top 20’ list for almost six years.
We should also keep in mind that the 875 MW increase yesterday is only compared to the prior record set three days earlier (which itself broke the then-prior record by 42MW).
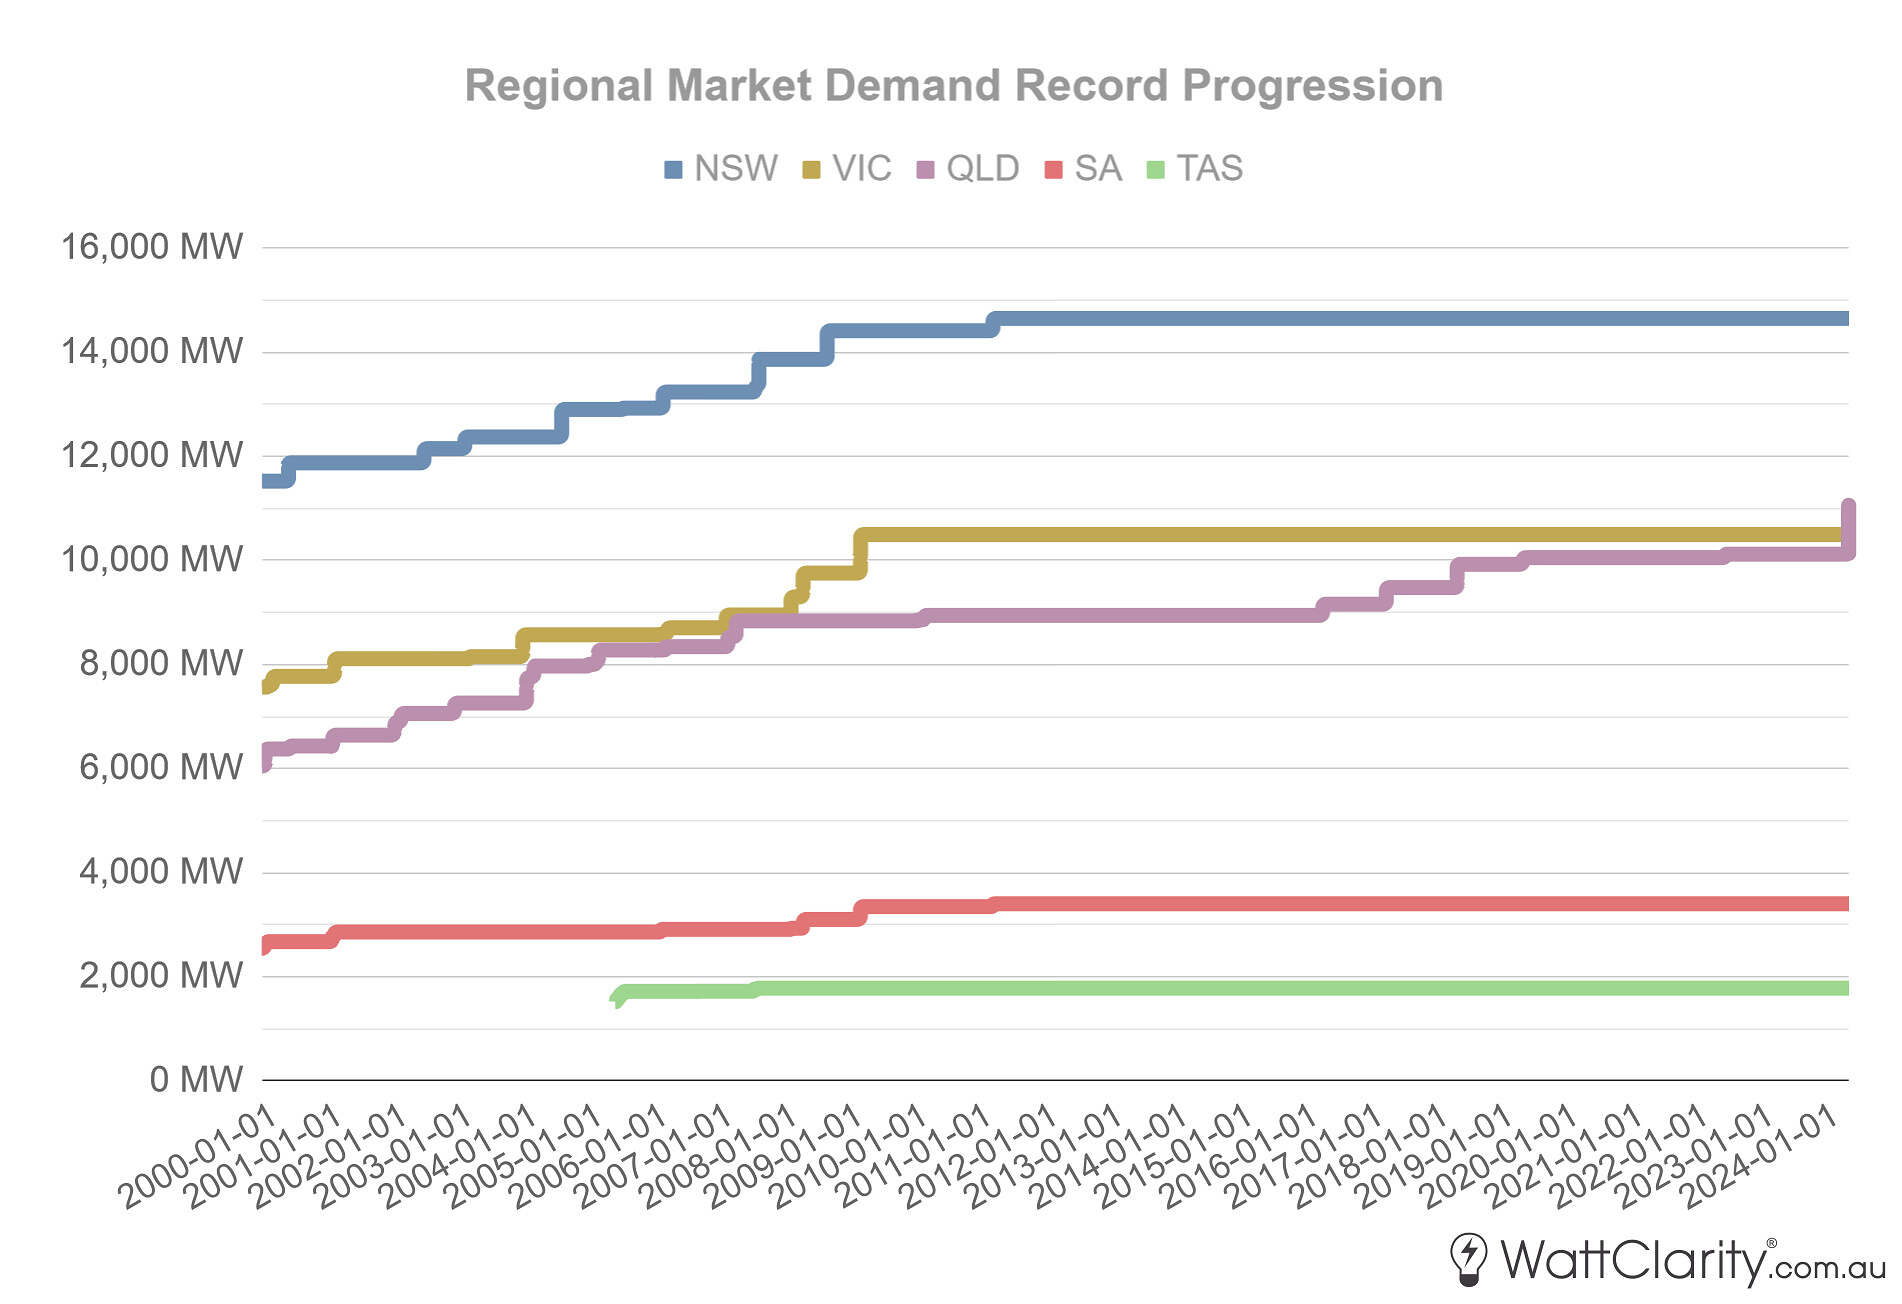
For further context, the below chart is a timeline of the progression of maximum market demand for each of the NEM’s five regions.

We see that peak demand (by this measure) in QLD has now surpassed peak demand in VIC.
In both of these charts, I’ve purposely ignored the period-of-time before Jan 1st, 2000 (the NEM began in late 1998, so hence very early records may not have been indicative of material changes in demand), as well as figures for the now-abolished SNOWY region.
What demand?
As always, I must note that there are several different measures of demand – each of which is useful depending on what you are trying to analyse. Here at WattClarity we generally track and provide commentary on ‘Market Demand’, or what is known as TOTALDEMAND in the AEMO’s MMS database. For our purposes as market watchers, this is the most relevant measure of demand because it is the most accurate capture of how much demand needs to be catered for by ‘things’ that the AEMO can dispatch/control through the market.
Market demand is therefore the sum of :
- Local Scheduled + Semi-Scheduled Generation minus Local Scheduled Loads
- Interconnector Flow at the Regional Reference Node
- Wholesale Demand Response
As well as:
- Forecast Demand Change & Aggregate Dispatch Error
Questions that remain
We’re still trying to make sense of what did and did not happen in QLD last night.
In the AEMO’s August 2023 ESOO, the 1-in-2 year peak demand level for QLD was 9,932 MW for Summer 2024, and the 1-in-10-year peak was projected to be 10,373 MW. Last night the operational demand level reached 11,005 MW during the 17:00 interval. This potential forecasting miss has prompted questions from others in our team about the long-term implications.
In relation to actual consumption yesterday evening, some underlying factors may have also influenced where demand figures landed:
- News.com.au is reporting that 41,000 properties in Southeast Queensland experienced thunderstorm-related outages during the early evening yesterday.
- I noted some posts on social media about residential users’ consumption being curtailed due to their participation in the Energex PeakSmart Air-Conditioning Program
Over the coming days and weeks, our team will surely dig through the many questions that continue to puzzle us.
Editor’s note:
(2024-01-23 8:56PM) Correction – the quoted ESOO forecast values are on a ‘sent-out’ basis, where as the actual demand value is on an ‘as generated’ basis. For reference, the POE10 forecast on an ‘as generated’ basis was 10,822 MW in the August 2023 ESOO data set – which is closer to the actual outcome but would still signify that yesterday’s demand levels exceeded the implied 1-in-10 year probability. My apologies for any misinterpretation caused.


Peak dispatchable supply occurred at 6:45 when wind and solar were supplying just 245 MW. 7.9 GW of available coal was supplying 6.7 GW and 3.4 GW of gas, diesel and biomass supplied 2.8 GW and 330 MW of batteries were supplying 125 MW so it appears that the system was well in hand
If this happens next year Qld will have Barron Gorge and probably Kidston 330 MW of hydro, at least 300 MW of batteries and of course Callide C. In total, almost 1.5 GW more dispatchable supply. With some 1.5 GW of wind and more than 1.5 GW of solar coming on line over the next 18~24 months, even if it is only running at 10% still a useful contribution. So assuming Queensland coal manages a bit better than 75% capacity next year there should be no problem
Batteries and pumped hydro are not generators – they store and release, using more electricity to charge/pump than what they discharge. Sadly batteries and pumped hydro seem to be continuously referred to as some type of dispatchable generation.
Absent coal generation and with the uncertain future of gas generation, batteries plus the Kidston, Borumba and massive Pioneer Burdekin Pumped Hydros will be reliant on excess solar and wind to recharge.
Hopefully they can recharge before the next peak demand period.
However, this could be a massive problem in a prolonged wind drought which could go for days or weeks or a heatwave that goes for 2 or 3 days.
Hopefully the sun will always come up but the wind doesn’t always blow…. and batteries and the pumped hydro will be hoping for the overnight wind to recharge.
But in the future Queensland could have new overnight demand in the form of a green hydrogen export industry and desalination plants in Southeast Queensland.
The evidence does not support your concerns. To have a reliable 95%+ renewable grid Queensland needs 3-4 times as much solar and 6-8 times as much wind and about as much storage as Victoria is planning.
Thus between 9 and 4 wind and solar would have been not only supplying all demand but most of the existing “offpeak” demand and still putting 6-8 GW into storage. At6:45 when coal output peaked, wind and solar would still have been supplying 3-4 GW,hydro and storage 6-8 GW. On a few occasions per year, gas might supply 20% of peak demand 10-15% of daily demand and 2-5% of annual demand
Hello Peter,
what about in a very serious drought?. I think you may need to revise your gas a touch higher?.
Interesting to note that the power outages were claimed to be due to storms but Moreton Bay Regional Council didn’t even experience rain and had a large portion of the power outages.
Also all that solar and wind and it produces nothing when demand is peaking.
Look at the chart in the previous article – PV was generating a significant proportion at the time of peak market demand, and even more at the time of peak underlying demand (which was of course higher, but also earlier and continued for longer).