
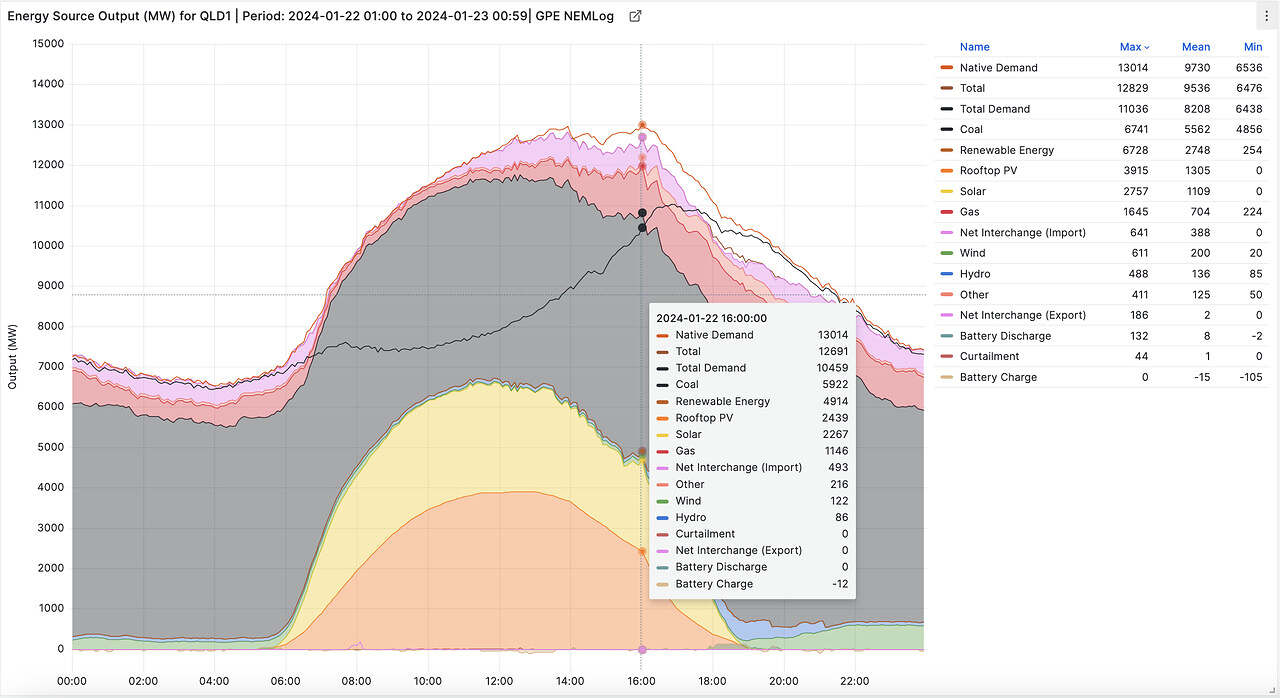
Yesterday’s (Mon 22-01-2024) record demands from Queensland’s (Qld’s) energy sector has indicated unsurprising significant shifts in energy demand patterns, with the Operational Demand receiving considerable attention in reports [1,2,3]. Alongside this, the increase in Native Demand, or Underlying Demand, (Total Demand + Non-Scheduled Generation + Rooftop PV) to 13,014 MW, which is a clear indicator of the growing nature and significant influence of behind-the-meter (BHM) Rooftop PV installations. This summary aims to present various types of demands and their record-breaking figures, considering possible underlying factors.
The record high for Qld Native Demand was 13,013.9 MW at 16:00 hrs on Mon 22-01-2024, a 10.82% increase from the previous peak of 11,743.2 MW at 14:45 hrs on Fri 19-01-2024 – see the graph below for Native Demand Records since AEMO started publishing BHM Rooftop PV in March 2018.
This record, which includes Qld Total Demand, Non-Scheduled Generation, and Rooftop PV, coincided with a period of extremely high temperatures and high apparent temperatures for a period of week, particularly in and around South East Qld and Brisbane. Additionally, this period marked a return to school and work for many, along with holiday seekers from the rest of Australia on their last week of school vacation, all factors that likely contributed to the surge in energy use.
Additionally, the Maximum Rolling 1-Day Mean Qld Native Demand saw a significant rise, reaching 9,728.9 MW at 23:00 hrs on Mon 22-01-2024. This was up 629.14 MW (6.91%) from the previous 9,099.7 MW at 05:55 hrs on Sat 20-01-2024, reflecting a week of persistently high temperatures without much relief.
Furthermore, the Maximum Rolling 7-Day Mean Qld Native Demand also set a new record at 8,692.0 MW at 23:00 hrs on Mon 22-01-2024, up 242.34 MW (2.87%) from the previous 8,449.7 MW at 23:00 hrs on Sun 21-01-2024. These increases are most likely again exacerbated by the extended period of high temperatures.
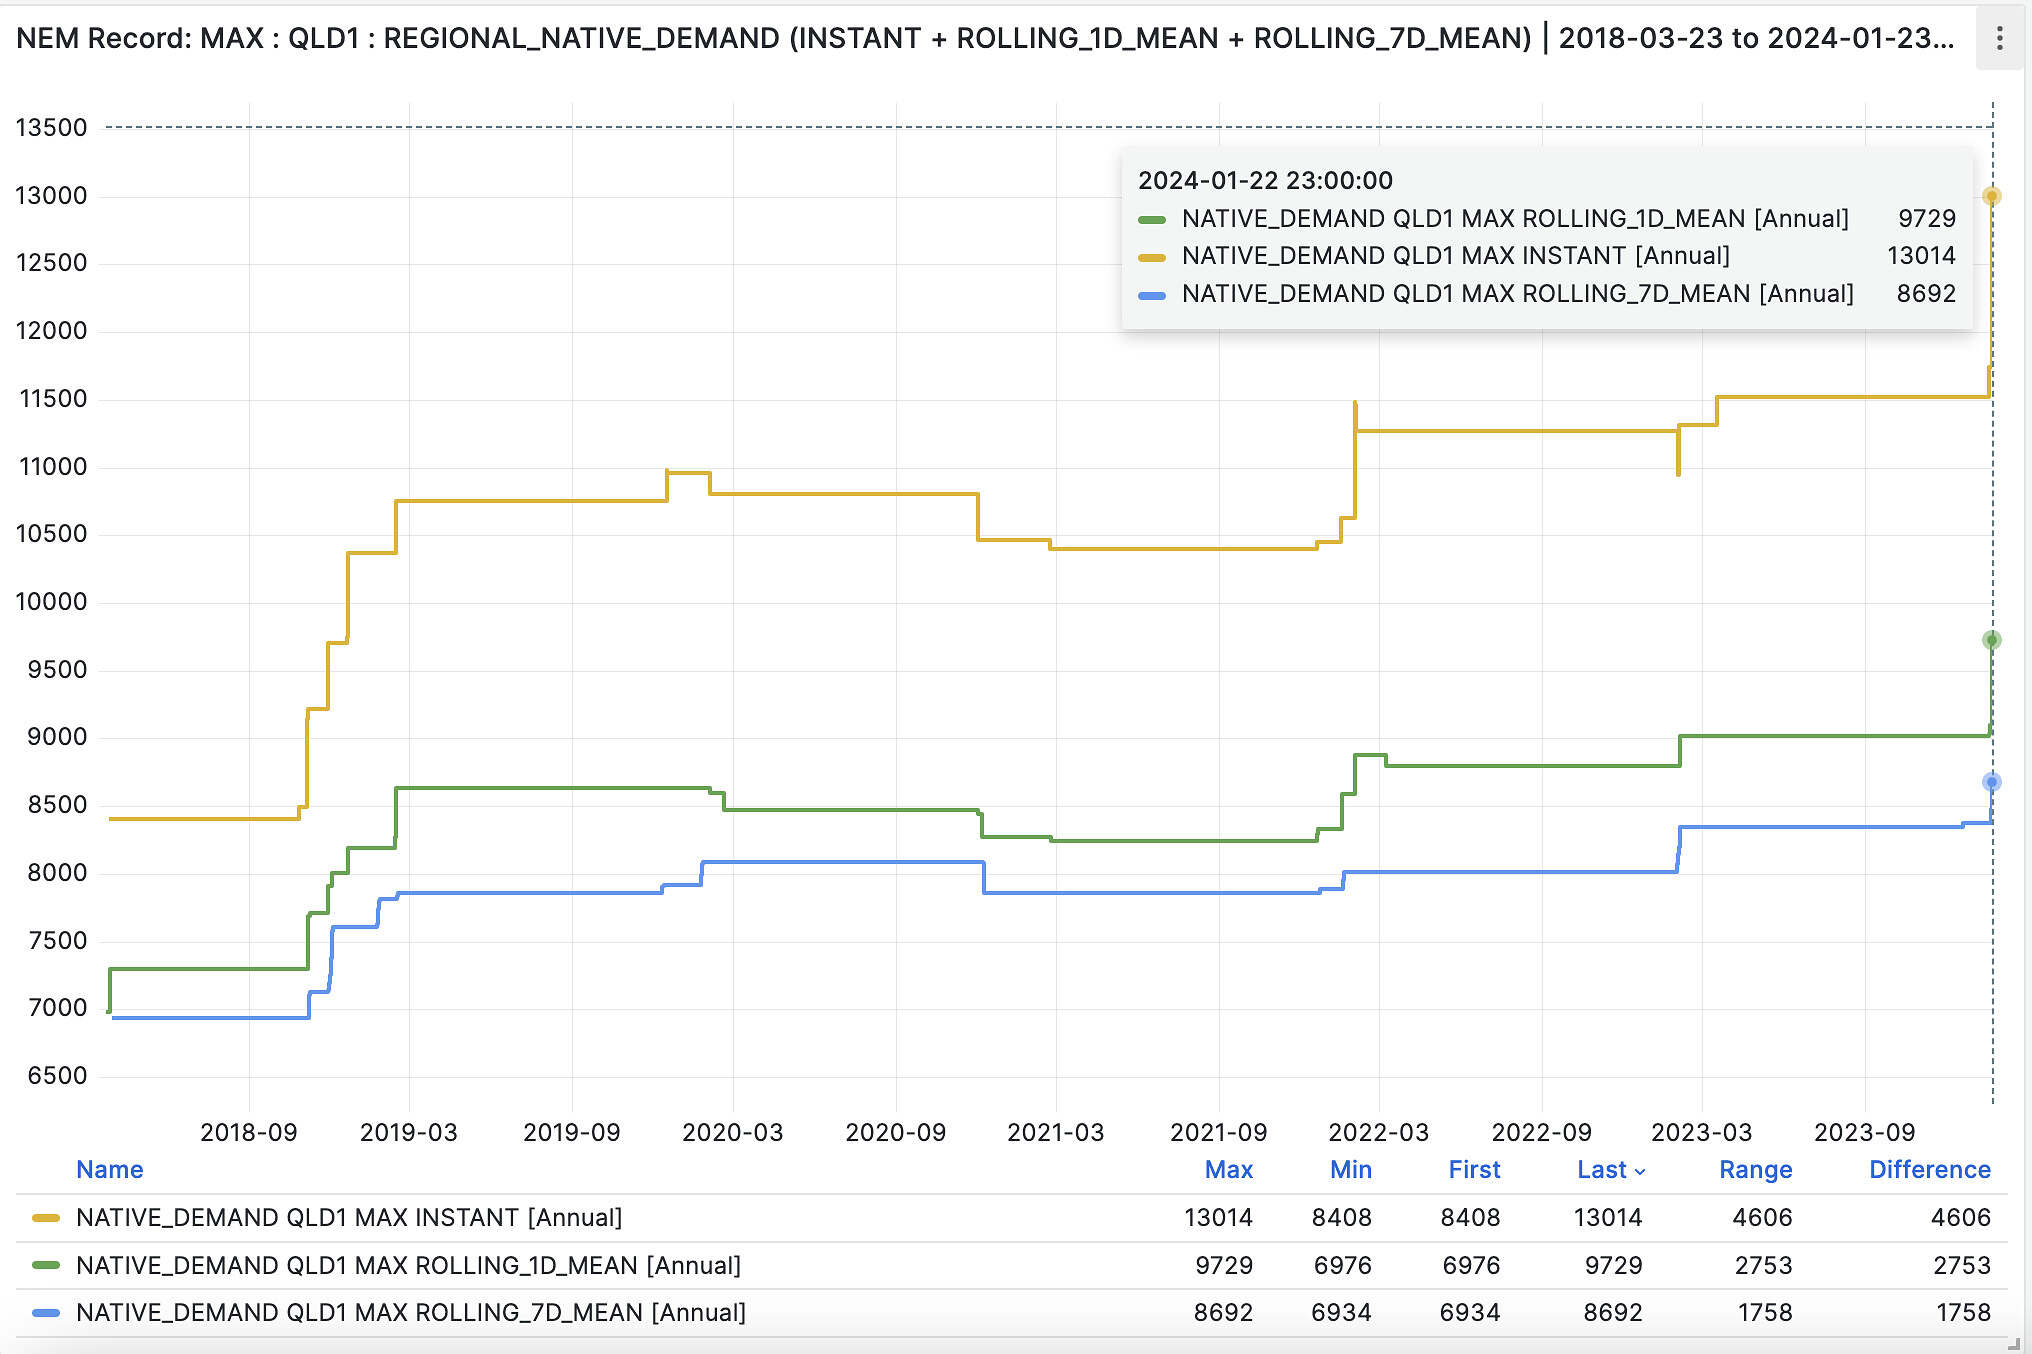
GPE NEMLog-Lite: Moving Annual Qld Native Demand Records – Max Instant, Rolling 1 and 7 Day Means
Notably, the article’s lead graph showing Qld’s energy shares and demands does not account for interconnector losses, going some way to explaining the discrepancy between Native Demand and sum of the energy source contributions plus the binding maximum imports from NSW.
Other significant Qld Demand records include:
- Qld Total Demand + Non-Scheduled Generation reached 11,154.5 MW at 16:50 hrs on Mon 22-01-2024, an 8.82% increase from 10,250.7 MW at 17:30 hrs on Fri 19-01-2024.
- Qld Total Demand was 11,036.2 MW at 16:50 hrs on Mon 22-01-2024, up 8.61% from 10,161.0 MW at 17:30 hrs on Fri 19-01-2024.
- Qld Operational Demand achieved 11,005.0 MW at 17:00 hrs on Mon 22-01-2024, 9.28% higher than 10,070.0 MW at 17:30 hrs on Fri 17-03-2023.
Further details are available in the Australian Energy Market Operator’s (AEMO) comprehensive 29-page document [4], which offers in-depth insights into these demand types.
These developments in Qld’s energy sector underscore the impact of both climatic conditions and social patterns on energy consumption.
[1] The heatwave temperatures felt across the state today have contributed to a new record in Queensland with demand on Powerlink’s electricity transmission network reaching an all-time peak of 11,005MW at 5pm .. (LinkedIn | Powerlink Queensland | Mon 22 Jan 2024).. https://www.linkedin.com/feed/update/urn:li:activity:7155161320177192960/
[2] The QLD ‘Market Demand’ has smashed through the 11,000MW mark, for the first time ever .. (LinkedIn | Paul McArdle | Global-Roam Pty Ltd | Mon 22 Jan 2024) .. https://www.linkedin.com/feed/update/urn:li:activity:7155091168832196609/
[3] #NEM: Queensland market demand has burst through 10,500MW. Still 80 minutes until the recent evening peaks at 17:30DI .. (LinkedIn | Josh Stabler | Energy Edge | Mon 22 Jan 2024) .. https://www.linkedin.com/feed/update/urn:li:activity:7155078673761554432/
[4] Demand Terms in EMMS Data Model (Australian Energy Market Operator (AEMO) , October 2021) .. https://www.aemo.com.au/-/media/Files/Electricity/NEM/Security_and_Reliability/Dispatch/Policy_and_Process/Demand-terms-in-EMMS-Data-Model.pdf
This article was originally published on LinkedIn, reproduced here with permission.
About our Guest Author
 |
Geoff Eldridge is a Principal Advisor at Global Power Energy. He is an experienced utilities analyst with over two decades of experience
You can find Geoff on LinkedIn. |
Be the first to comment on "Powering Up: Queensland’s Historic Leap in Energy Use"