On Tuesday 9th January 2024 I wrote about ‘Hiccups at Loy Yang A4’, and then on Thursday 11th January 2024 I wrote ‘Hiccups continue, at Loy Yang A4’ following another trip/outage of the units … the 4th in a short space of time.
This is the third article in a series, and follows some questions I’ve received … and discussion I’ve noticed on social media.
(A) Loy Yang A4 is back online
First and foremost, let’s start by noting that Loy Yang A4 units is back online (at least at the time of this article).
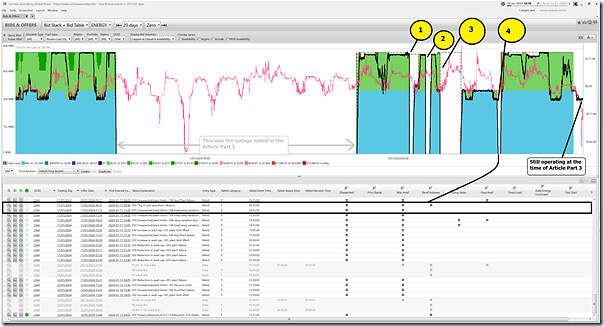
I wrote Part 2 following a trip of the unit around 12:25 NEM time on Thursday 11th January – but I was then otherwise occupied, and did not see the unit start back up later on Thursday. Here’s a broader summary of activity at LYA4 unit via ‘Bids & Offers’ widget in ez2view as at 12:10 on Sunday 14th January 2024:
From the return to service later on Thursday 11th January 2024 we can see the unit’s been operating similarly to how it was a month ago (prior to the forced outage that kicked this whole thing off).
(B) Loy Yang A, in the Victorian region
Some of the questions I’ve received (and otherwise seen in social media commentary) have revolved around the significance of Loy Yang A (and particularly the A4 unit) in the broader Victorian region.
So I thought it would be useful to summarise a few points…
(B1) Aggregate levels (in MWh), and averages (in MW)
Remembering that a megawatt (i.e. MW) is a measure of a rate of production and a MWh is a measure of a volume … let’s start with a look at the aggregate level of significance of the station.
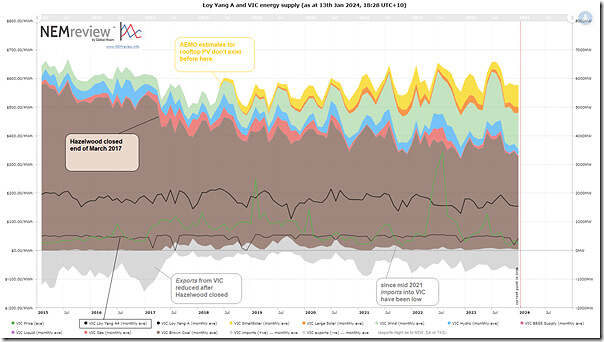
I’ve prepared this query using NEMreview v7 to help provide some context to the overall level of energy supplied by the 4-unit Loy Yang A station into the Victorian region of the NEM (and the Loy Yang A4 unit in particular):
Those with their own licence to the NEMreview software can open their own copy of this query here.
With respect to this chart:
1) this chart looks back 9 years from the end of 2023 and …
2) looks at how the supply mix supplying consumption in Victoria has changed on a monthly basis over that period – including both:
(a) monthly average* levels of production in Victoria from all the various fuel types.
(b) and also average* level of support from (or to) other regions, where:
i. average levels of aggregate import (from TAS, SA and/or NSW) are shown above the line as positive numbers,
ii. whilst average levels of aggregate export (to TAS, SA and/or NSW) are shown below the line
* so readers might multiply these averages by the ~720 hours in a month (different for each month, obviously) to calculate a volume of energy (in MWh) supplied in each month.
3) There’s many things that are apparent in this trend, but here’s a couple big ones:
(a) The fuel mix has changed significantly in VIC over that period (especially with the increased share supplied by VRE) … though brown coal still supplies the largest share
(b) There was a step change reduction in brown coal in April 2017 following the closure of Hazelwood.
4) Over the 9 years shown, there are three broad periods in terms of inter-regional flows:
(a) Up until Hazelwood closed, VIC was a strong exporter;
(b) The closure of Hazelwood changed that, leading to months where VIC imported more than it exported.
(c) But from the start of 2021 the VIC region has been growing more export dominant again.
… I’ve not looked in detail at the reasons for this (readers should remember that this might be due to factors inside VIC, or outside VIC, or both).
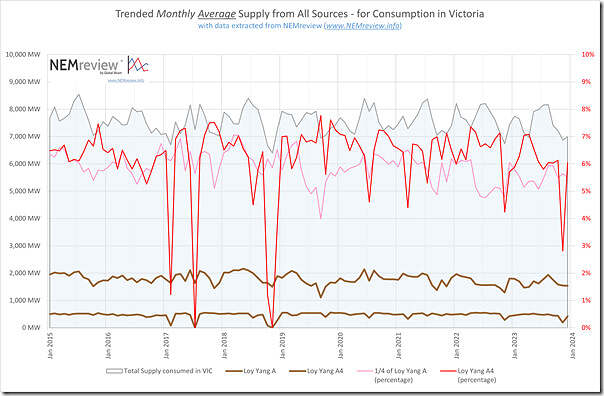
Focusing specifically on the Loy Yang A station (and the LYA4 unit) I’ve extracted the data to excel and compiled the following view:
The key point here is that, in terms of aggregate volume of energy supplied, the LYA4 unit typically supplies between 5% and 7% of the total volume of energy consumed in VIC each month.
1) This dropped to 0% in a couple months historically where the unit was out for the whole month
2) … so that’s the reason why I’ve also shown one quarter of the aggregate percentage supplied by all 4 x Loy Yang A units (i.e. an ‘average per unit’).
3) … and we see the numbers line up quite well.
(B2) Supply sensitivity at time of tight supply-demand balance
Remembering that LYA4 is back online at the time of this article (so hopefully the hiccups are behind it) there’s an academic question some might ask about the significance of the unit at times of tight supply-demand balance.
Because summer 2022-23 and summer 2021-22 and summer 2020-21 saw lower levels of demand (e.g. due to La Nina and COVID lockdowns etc), we have to case our mind back to summer 2019-20 to when Victoria supply-demand balance was particularly stretched.
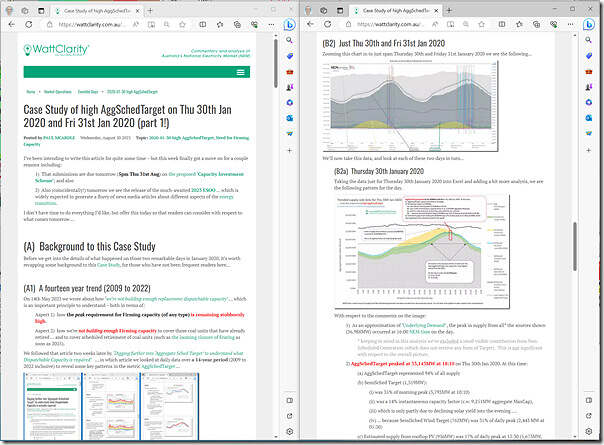
The two-day period 30th and 31st January 2020 particularly comes to mind, as explored in the article ‘Case Study of high AggSchedTarget on Thu 30th Jan 2020 and Fri 31st Jan 2020 (part 1!)’ published in August 2023:
That analysis was focused on NEM-wide data (not Victoria in particular) and also looked at Aggregate Scheduled Target (not supply from any particular scheduled station or unit (like LYA4)) … but at some point we might add another part to that Case Study.
For now we’ll leave that on the back-burner:
1) Because (as noted above) LYA4 unit is back online; but also
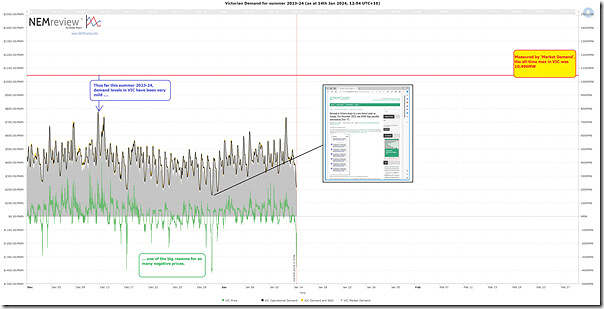
2) But also because the weather experienced so far this summer 2023-24 in Victoria, and demand patterns that have ensued (particularly on 31st December 2023), seem to suggest a low probability an extreme event like this might eventuate this summer.
(a) As we see here in this trend from NEMreview:
(b) but reader’s beware that I am certainly not a meteorologist (and there may still be surprises in store)!
That’s all for now…


Be the first to comment on "Hiccups over, at Loy Yang A4? (Part 3)"