[Belatedly posted late on Wed 1st Nov 2023 after other distractions today]
On Tuesday 19th September 2023 we posted about ‘Current outage plans for Kogan Creek – with threats of industrial action’ … in part spurred by Mark Ludlow’s article about looming industrial action.
That article was followed by other articles on 21st September, then on 27th September, and on 29th September.
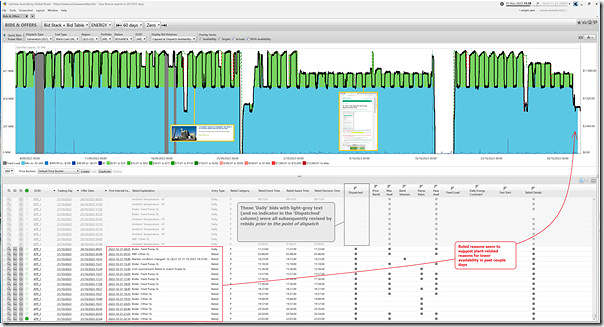
It’s now 6-weeks-and-1-day past that initial article and there are several reasons to have another look at what’s happened since 19th September, which I have done via the ‘Bids & Offers’ widget in ez2view (new version 9.8.5.1 just released yesterday) filtered just to Kogan Creek and looking back 60 days:
As we try to do with all images embedded in articles, click on the image for a larger view.
This widget’s not been enhanced in these recent upgrades – but others have, as noted below. I’ve annotated the image to include some pieces of context, including:
1) Industrial action mooted to happen from 19th September;
2) The commencement of the more detailed (and very welcome!*) MT PASA DUID Availability data from Monday 9th October; and
* thanks to the AEMC for that enhancement … but let me repeat again the request that this publication requirement should also extend to Semi-Scheduled units as well.
3) Not shown in the image above, but scrolling back through rebid reasons over the past 60 days:
(a) There are plenty referencing ‘ambient temperature’ … which is totally understandable because:
i. High temperatures affect pretty much all generation technologies (as we’ve noted often before, such as in February 2020);
ii. There have been days in the past couple weeks that have been all-too-soon like summer; and
iii. Notable also that Kogan Creek is dry-cooled, so (I believe – dusting off a few engineering cobwebs in my brain) more significantly affected by high ambient temperature.
(b) However I did not see in a quick scan any rebid reasons referencing any form of ’industrial action’;
(c) Also of interest to me is that I did not see any rebid reason referencing anything like ‘bushfire’ …
i. Queensland has far too many of these underway at present, so we have been keeping watch on a number of units.
ii. I did notice other stations occasionally having Constraint Equations invoke because of bushfire (remembering that constraints are always invoked in Constraint Sets)
… but that’s scope for a different article.
4) In the past couple days, we see rebids relating to (what seems to be) plant physical problems … with output trending down lower today through the middle of the day …
… noting the screenshot above captured at 11:15 NEM time Wednesday 1st November, and bids are only visible ‘next day public’ (i.e. until 04:00 this morning).
About the enhanced ‘Generator Outages’ widget in ez2view
Given we have just released ez2view version 9.8.5.* with further enhancements on the ‘Generator Outages’ widget, I was particularly interested to see what was showing now, in relation to Kogan Creek (i.e. with what seems to be physical problems limiting its capability over the past couple days) – but also more generally for the entire coal fleet.
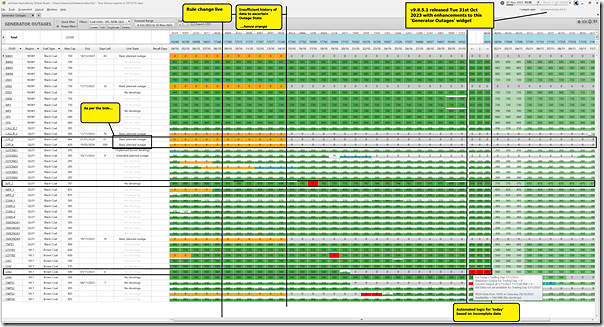
So I opened that widget up and filtered down to Fuel Type = Black Coal or Brown Coal:
With respect to this image, I’ve annotated with a few things and will follow up with specific generators/clients about these and others:
1) With respect to all unit outages shown above, before Sunday 15th Oct 2023 there’s insufficient history built up in the new ‘Unit State’ data set to be able to that data to inform the colouring decision:
(a) i.e. no ‘Unit State’ published on Saturday 7th October for the following week; and
(b) as such, all cells showing 0MW (i.e. fully unavailable for the whole Market Day) are coloured Orange.
2) With respect to Kogan Creek, we see:
(a) On 17th October we see a Forced Outage for the day … which we can also see in the image from ‘Bids & Offers’ at the top of this article.
(b) In the near future we do not see any outage planned (i.e. in this MT PASA DUID Availability data) – suggesting no plans currently (at least visible in this data) to take the unit off to work on the physical plant limitations seen more recently..
3) Regarding Callide C, we see that the ‘Unit State’ data from Monday 9th October has suggested that both units are on ‘Basic planned outage’ (unless we have screwed up our logic in some way – hence the grey colouring of those cells) … but we know our logic used in Appendix 5 in GenInsights Quarterly Updates (which we wrote about here) has marked these units as on Forced Outage, because both units initially came out because of technical problems:
(a) Callide C4 came off on 25th May 2021 with the explosion, and has been off since (outage extended for cooling tower rebuild); and
(b) Callide C3 came off on 31st October 2022 with cooling tower failure and still has 67 days to go, based on current Return-to-Service schedule.
… so we’re interested in informed readers views on whether this is a realistic automated prognosis with the data available at the time of the snapshot?
4) We see that Loy Yang A3:
(a) Is highlighted red (inferred forced outage) for ‘today’:
i. where the day before (and preceding) were bid by the participant as ‘Basic Planned Outage’
ii. yet at the same time that bid was submitted (Sat 28th Oct for 18:00) the bid submission for ‘today’ (i.e. Wed 1st Nov) was that it would be available.
(b) Some of this context is captured in the mouse-over tool tip (captured in the image)
… so we’re interested in informed readers views on whether this is a realistic automated prognosis with the data available at the time of the snapshot?
5) A somewhat similar situation (i.e. red colour – inferred forced outage) is also shown for ‘today’ for Yallourn unit 1 …
… we’re interested in informed readers views on whether this is a realistic automated prognosis with the data available at the time of the snapshot?
Remember it’s early days for this widget (i.e. with the new data that just went live on Monday 9th October … only 3 weeks ago):
1) We’ve just tweaked the logic (with v9.8.5.1) based on a couple weeks of real data,
2) And expect that there’ll be more evolution to come as we try to reconcile the imperfect data available in real time and the desire to assist users as much as possible form a good view of the state of all Scheduled assets (particularly through summer 2023-24)
3) … so we’re keen on feedback from clients (and other readers here) about what we might do to make the data more understandable?
Thanks, in advance, for your input…


Be the first to comment on "An updated look at Kogan Creek performance in the past 60 days (re industrial action, bushfires, ambient temp, ez2view enhancements, and more)"