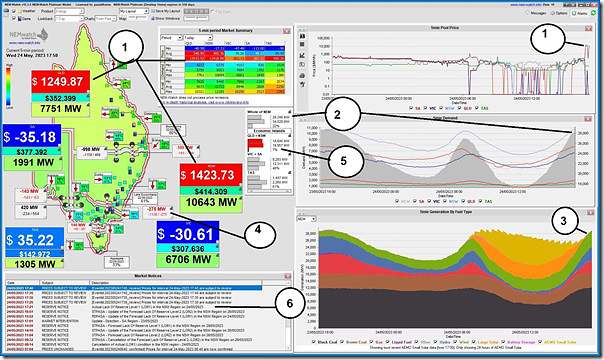
As has been the case for a number of days recently (like Saturday 20th May), we’re seeing volatility currently in QLD and NSW, as shown in this snapshot from NEMwatch at 17:50:
As per the numbered annotations on the image:
1) Volatility began at 17:30 with spikes up towards the Market Price Cap and has continued since that time
2) NEM-wide ‘Market Demand’ is quite modest, at just over 28,000MW
3) There’s a fair amount of wind production currently (which is different than yesterday)
4) Prices are split because of constraints on VIC1-NSW1 interconnector … which is being forced to flow south currently, despite the price differential.
5) The IRPM for the QLD+NSW ‘Economic Island’ is down at only 7% at this dispatch interval:
(a) With 19,957MW available capacity supplying 18,640MW net ‘Market Demand’ (i.e. including the 275MW export to VIC);
(b) Leaving 1,317MW spare capacity across NSW and QLD:
i. at any price.
ii. some of which might also be constrained.
(c) Hence 7.07% IRPM before rounding.
6) There’s an Actual LOR1 condition in the NSW region currently.
Nothing more at this point.


Leave a comment