A couple people have contacted us to ask, so this article is hastily put together to mark the volatility we saw in several regions of the NEM today … but we’ll really need to leave until follow-on articles to explain the ‘why?’ in any level of detail.
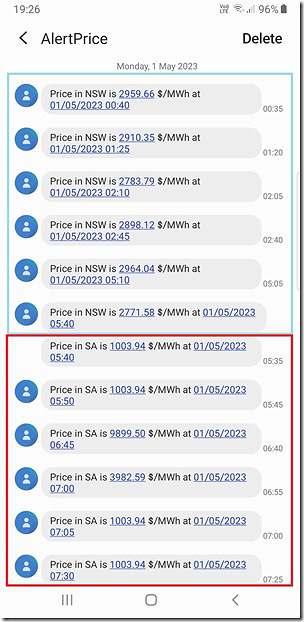
Here’s a snapshot of some of the SMS alerts received through the day with prices in NSW and SA breaching the $1,000/MWh alert criteria:
We saw NSW volatility occur in the early hours of the morning, whilst SA volatility picked up around the time when Underlying Demand typically starts ramping up for the day.
(A) A quick look at volatility in NSW
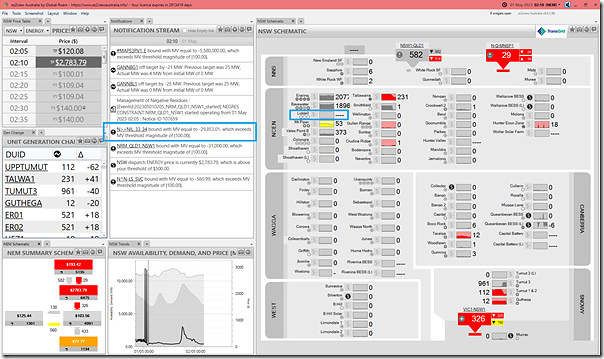
Using Time-Travel in ez2view, here’s a view of a number of widgets in a NSW-focused window to highlight some of what was happening in NSW at the 02:10 dispatch interval.
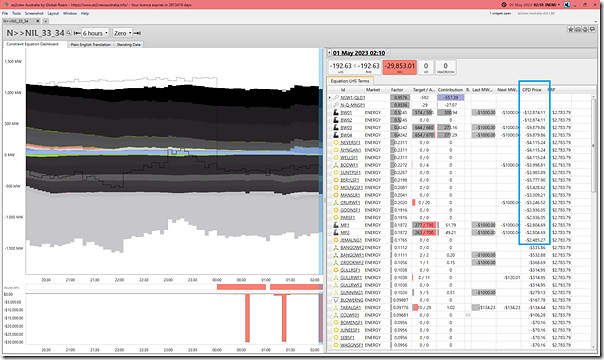
The ‘N>>NIL_33_34’ Constraint Equation is bound with a significant Marginal Value (and we can see many DUIDs flagged as affected by various constraints in the NSW Schematic), so we drill into the ‘Constraint Dashboard’ widget for a quick look:
In the snapshot above, have a look at the very low CPD Prices highlighted for a number of units.
The description of the constraint from the ‘Standing Data’ tab is as follows:
‘Out= Nil, avoid Bayswater to Liddell (33 or 34) O/L on loss of other Bayswater to Liddell (34 or 33), Feedback’
There’s obviously more involved here…
(B) A quick look at volatility in SA
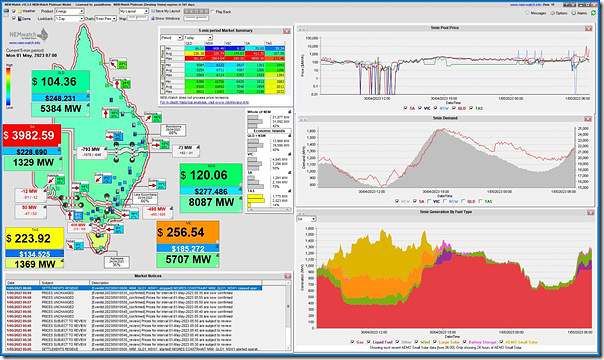
Here’s a snapshot of NEMwatch taken at the 07:00 dispatch interval, one of the ones seeing volatility in South Australia (dispatch/trading price up at $3,982.59/MWh):
There’s a couple things readers should be able to notice in the above.
(C) Explanations?
More detailed explorations (and explanations) will need to wait until later…


Leave a comment