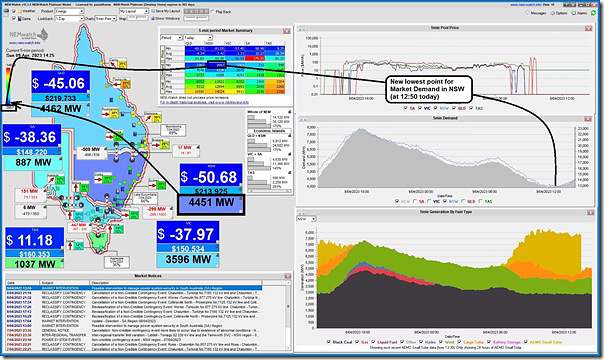
A quick for Easter Sunday to record this new lowest-point for ‘Market Demand’ in the NSW region.
Here’s a snapshot from NEMwatch at 14:25 on Sunday 9th April 2023 – which is a little after the lowest point reached for ‘Market Demand’ at 12:50 (at 3,957MW):
At this point in the snapshot, the Market Demand has risen slightly (to 4,451MW).
1) Referring to ‘Market Demand’ the prior lowest point was down at 4,130MW on 29th October 2022 as recorded in this article at the time.
2) Hence by this measure, the new record is 173MW lower than the prior minimum point.
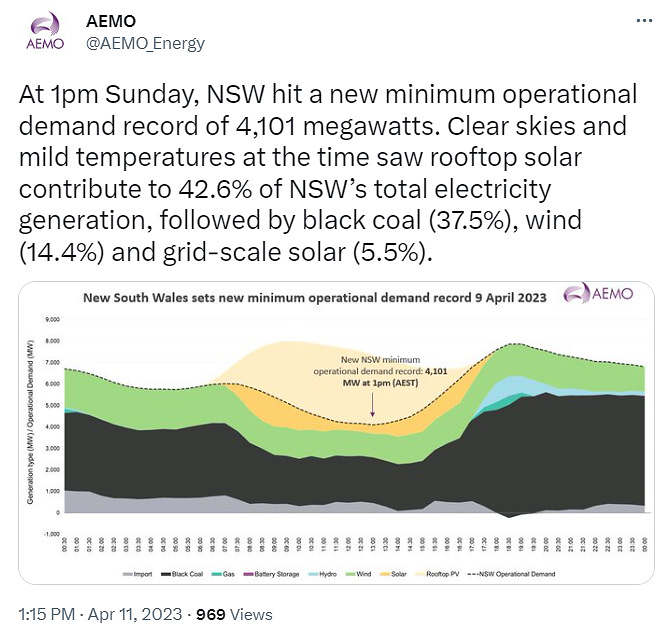
Using the AEMO’s more preferred ‘Operational Demand’ measure, the previous lowest point was also on 29th October 2022 and was down at 4,356MW.
1) By that measure, the lowest point today (4,101MW in half-hour ending 13:00) was also a new lowest point.
2) That’s a significant reduction (254MW) below the prior lowest point not yet 6 months ago.
I assume the AEMO will be along a little later to confirm all of this.
PS1 AEMO confirmation
On Tuesday afternoon, 11th April the AEMO confirmed that this was the case:


Could you please explain the difference between market demand and operational demand?
The difference is mostly due to demand met by “non-scheduled” generators who do not bid their output into the spot market. “Operational” demand includes this component, but “market” demand is exclusively the amount which is supplied by generators through the spot market.
The more telling information is what the demand is in the sunset to two hours afterwards. That is the size of the duck curve which the grid operators will need to ramp up for each day.