My small addition to WattClarity’s coverage of the latest South Australian islanding event deals with what’s been happening in the FCAS markets, who’s winning, and how it may be these normally-obscure ancillary markets that are providing price incentives to keep conventional generators online in the face of surprisingly subdued energy prices.
In the events following South Australia’s previous lengthy separation from the NEM in January & February 2020, we noted here on WattClarity that FCAS prices spiked, and looked at some of the impacts in dollar terms.
We’ll follow a similar approach here but keep it shorter, and refer readers to WattClarity’s other articles on the separation for all the background to the current islanded status of the South Australian region.
How high?
First, what have prices done since the event?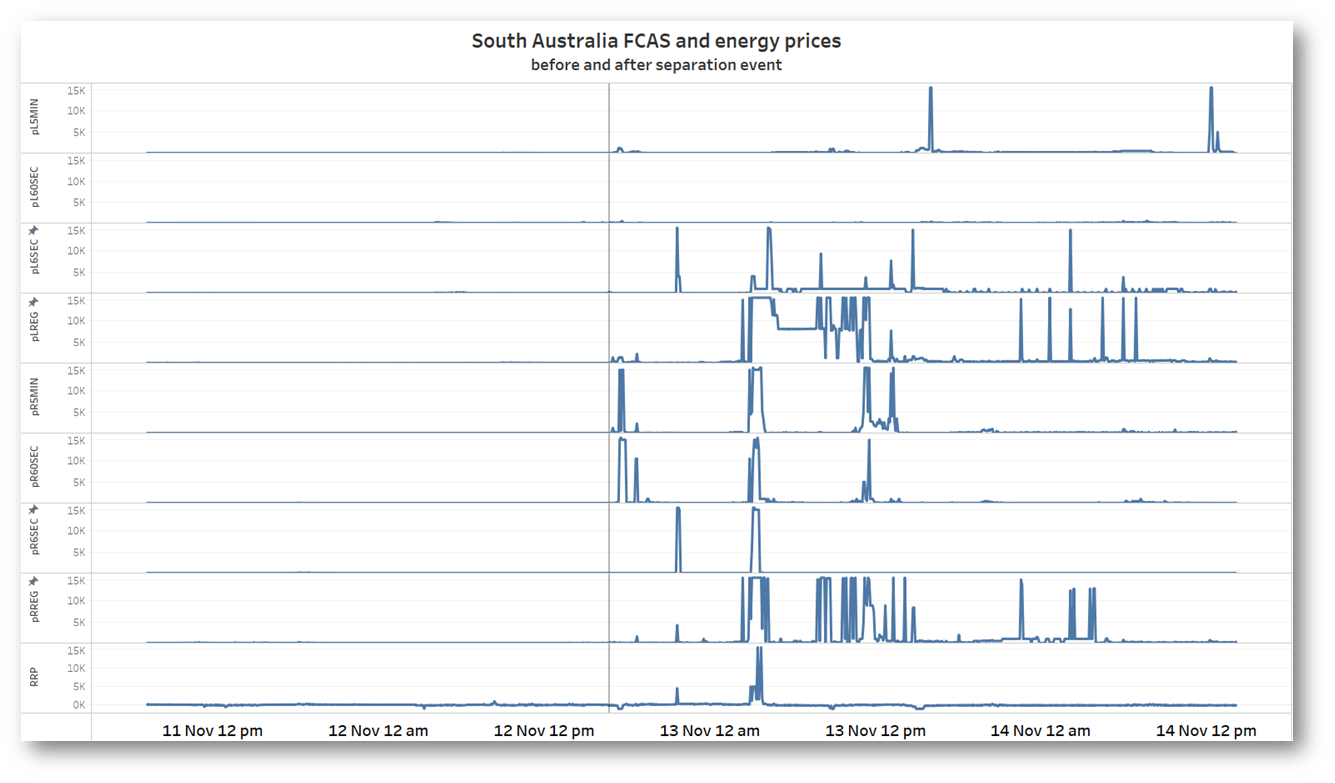
The energy price (Regional Reference Price or RRP) is at the bottom of the chart and hasn’t shown much volatility except in the early hours of Sunday 13 November. Even with that volatility its average since the separation event has been just $92/MWh, with longish periods in negative territory.
FCAS prices on the other hand have shown plenty of volatility right up to the market price cap of $15,500/MWh, with the single exception of the 60 second contingency lower service. As I write, I see that the most volatile FCAS price, for the Lower Regulation service, has just been automatically capped at $300/MWh after reaching its Cumulative Price Threshold (CPT).
This volatility in FCAS prices is not surprising since all requirements for South Australia have to be provided locally when islanded, whereas in normal circumstances FCAS services can often be provided from anywhere in the NEM, making for a much larger pool of suppliers and more price competition. Even so, the current levels of volatility are not as extreme as those seen after the January 2020 separation event.
How big?
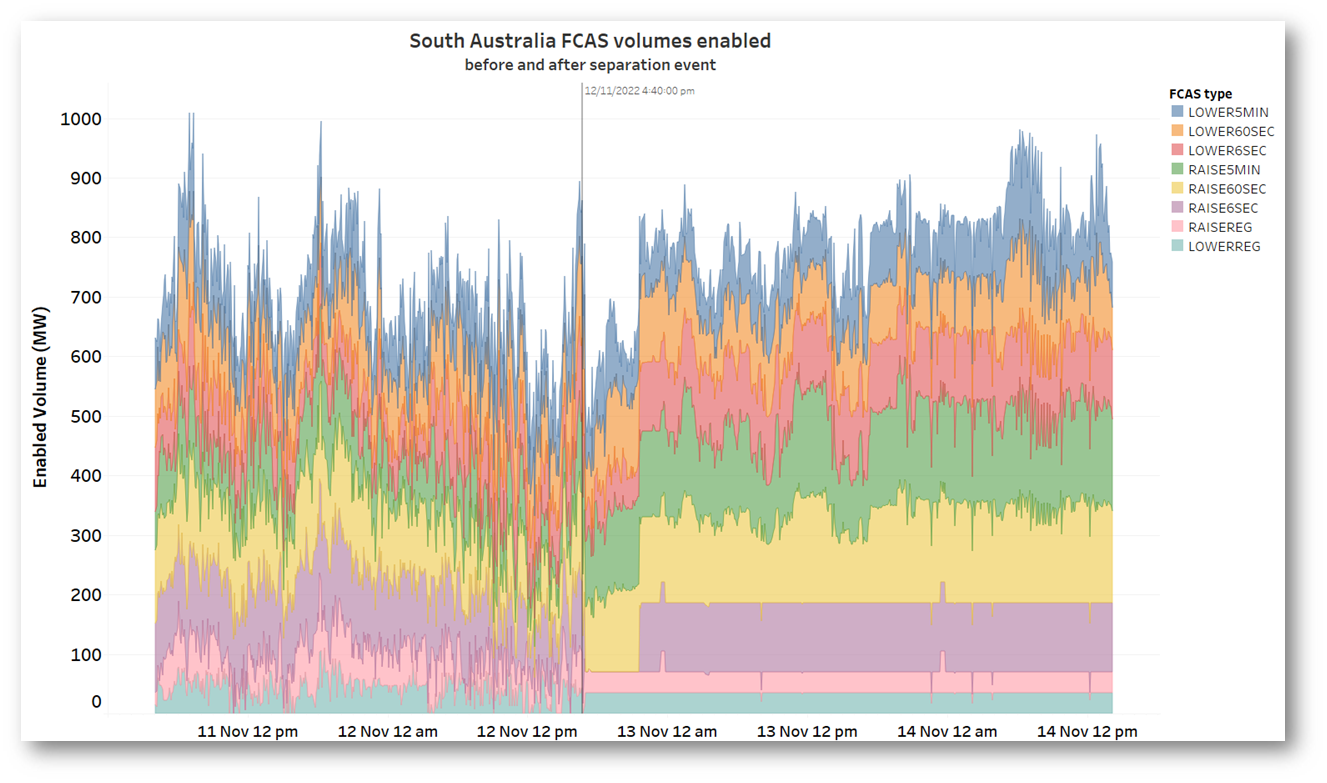
What about total FCAS volumes dispatched (or more correctly: “enabled”) in South Australia?
Before the separation, volumes of each service enabled were much more variable – reflecting their NEM-wide procurement which meant that no particular level of these services needed to be sourced from within South Australia in any five minute dispatch interval. Post-separation, we see generally more stable volumes being enabled in the islanded region to meet local needs, but the aggregate level is actually fairly similar to the pre-separation average. That’s probably more coincidence than anything else, but does point to South Australian providers supplying a significant slice of the NEM’s FCAS services under normal circumstances – probably larger than the region’s typical share of NEM energy.
Show us the money
Putting together prices and volumes, here are the cumulative values of FCAS services and energy earned by South Australian providers running from an arbitrary starting point about 36 hours prior to separation and about 42 hours afterwards (up until 3pm AEDT today).
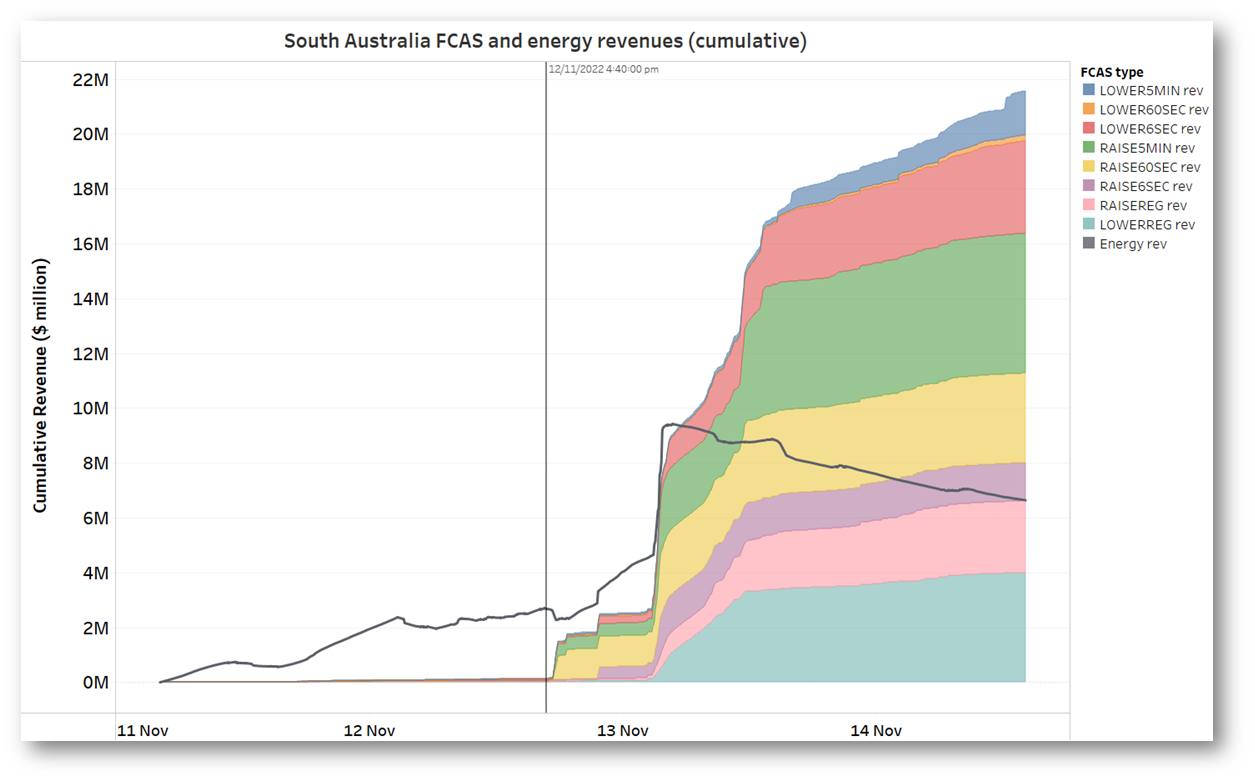 So here we see that all that FCAS volatility since separation has driven big chunks of revenue for suppliers in the region. By comparison, cumulative energy revenues grew quite rapidly in the 12 hours following separation, particularly during a burst of spot price volatility between 3am and 4am NEM time (AEST) on Saturday evening, but have been going backwards ever since, due to sustained negative prices (averaging around negative $77/MWh in fact).
I won’t go into details of the individual FCAS services here, but will point out that the costs of the two Regulation services (RAISEREG and LOWERREG) are recovered under complex “Causer-Pays” arrangements from both market customers (think retailers here) and generators, while those for the Contingency Raise services (RAISE6SEC, RAISE60SEC, and RAISE5MIN) are recovered exclusively from generators, and those for the Contingency Lower group (LOWER6SEC, LOWER60SEC, and LOWER5MIN) exclusively from market customers. So the big lift in FCAS costs post-separation is at least going to be spread around both sides of the market.
Whose money?
We can work out which suppliers have earned what in the FCAS and energy markets up until the end of the previous trading day (4am) from data released daily by AEMO. For the current trading day we can only work out the aggregate amounts. Here are the results for the post-separation period so far (I’m showing here only those facilities which supply FCAS, with or without energy).
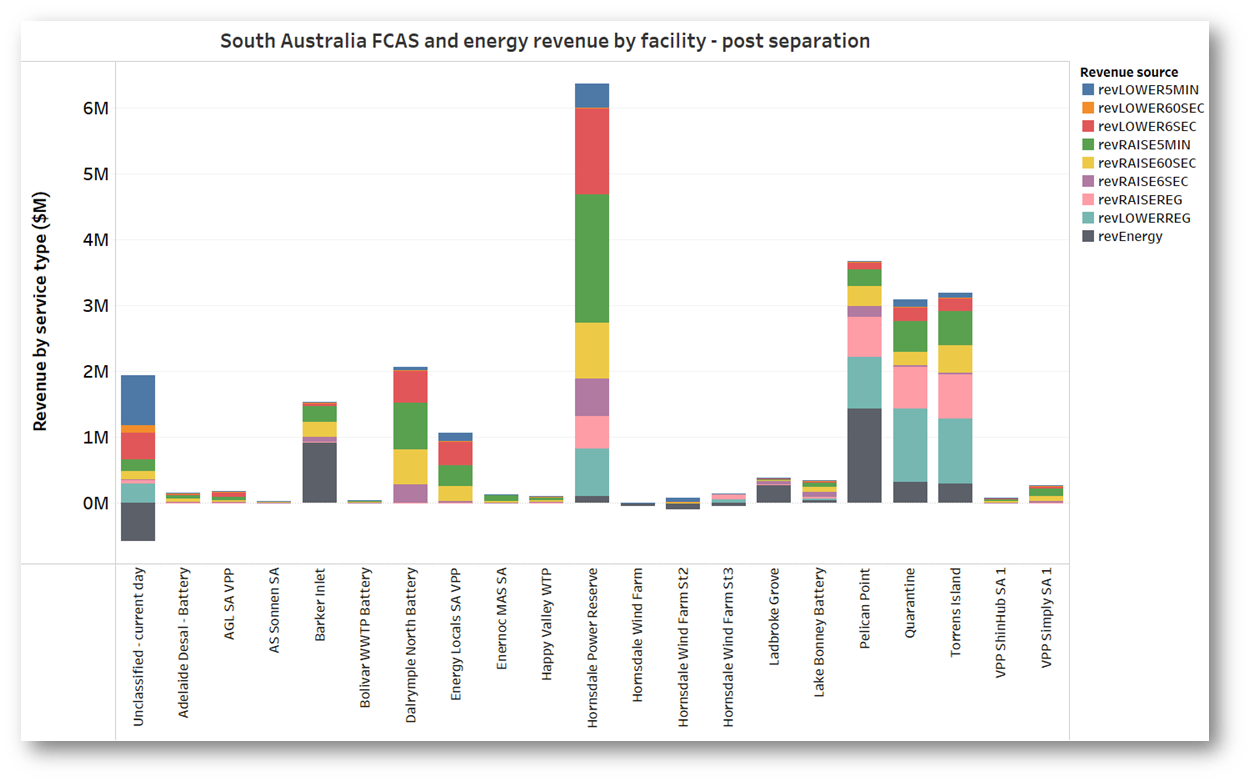 No surprise to see the Hornsdale Power Reserve or Tesla big battery the winner here. If he’d wanted to make money rather than burn it up, Elon Musk should have stuck to batteries instead of buying Twitter. The small Dalyrmple North Battery is also very prominent, while it’s no surprise to see gas-fired generators at Pelican Point, Torrens Island, Quarantine and Barker Inlet also in the money as they are suppliers of most of these FCAS services in addition to energy. Also notice a smattering of Virtual Power Plants (VPPs) appearing here, led by Energy Locals (which I believe is the aggregator for the Tesla home battery VPP program initiated by the previous South Australian Labor government – another Elon Musk link).
See why they run
Finally, bringing together revenues with the total energy produced (or in the case of some battery and VPP providers, not produced), we can calculate average unit revenues being earned by these FCAS suppliers across all markets (including energy).
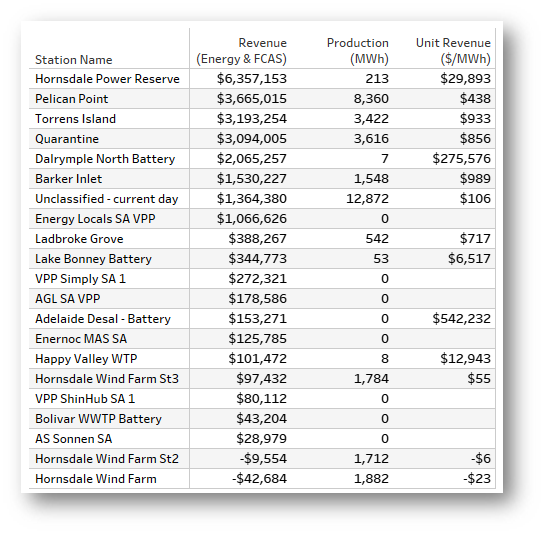 Some fascinating results there – Dalrymple North has injected a grand total of 7 megawatt hours but earned over a quarter of a million dollars for each of those. But that is topped by the tiny Adelaide Desal Plant battery’s $542k per megawatt hour, and the VPP players’ earnings on no megawatt hours at all!
Of course injected MWh is a bit of a nonsense denominator for batteries and virtual power plants providing almost exclusively FCAS services not energy to the wholesale market. They are being paid for (very important) technical capability, not for generating power.
But if we look at the gas-fired generators, which are providing a fair chunk of the island’s energy (along with the poor old windfarms, who apart from the Hornsdale trio haven’t bothered to register as FCAS suppliers), the unit revenue figures are much more meaningful. Before crunching these numbers I was a bit puzzled that in the face of pretty low energy prices, almost all these gas plants seemed happy to run with no direction from AEMO required. But seeing their unit revenues – signficantly driven by FCAS income – in the $400-$900/MWh range, it’s now a lot clearer why.
=================================================================================================
About our Guest Author
 |
Allan O’Neil has worked in Australia’s wholesale energy markets since their creation in the mid-1990’s, in trading, risk management, forecasting and analytical roles with major NEM electricity and gas retail and generation companies.
He is now an independent energy markets consultant, working with clients on projects across a spectrum of wholesale, retail, electricity and gas issues. You can view Allan’s LinkedIn profile here. Allan will be ocassionally reviewing market events here on WattClarity Allan has also begun providing an on-site educational service covering how spot prices are set in the NEM, and other important aspects of the physical electricity market – further details here. |


Leave a comment