Around midnight leading into Thursday 8th September (i.e. this morning) we saw a run of volatility in South Australia that lasted around 90 minutes – and this morning I posted this quick ‘Part 1’ article to record the event.
In this ‘Part 2’ article I share a couple things that I noted whilst tinkering with ez2view at times of multi-tasking during the day today – but readers should note:
1) that this is not a comprehensive review;
2) so I may well have missed (and misinterpreted) things;
3) so (perhaps) there might be a Part 3 article to follow … though the chances of that are not huge as there’s so many other things going on.
So this this caveat in mind, readers might find the following additional observations useful.
(A) Price spike not expected in advance … or was it?
Oftentimes for me when events like this occur, my first question tends to be ‘was it anticipated in advance?’ … and for this the ‘Forecast Convergence’ widget in our ez2view software is an excellent tool.
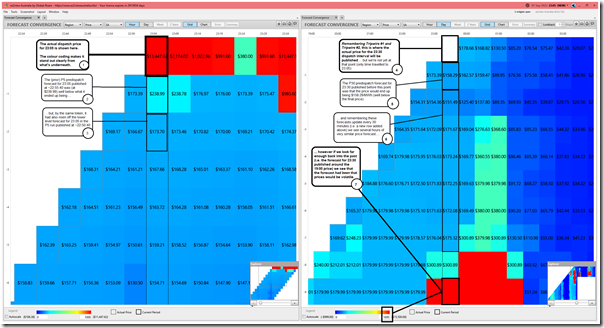
Here’s a snapshot taken in ez2view Time-Travelled back to 23:05 on Wednesday evening 7th September, which is when the first price spike occurred (up to $11,447.62/MWh in the SA region). In this snapshot, we look at
As we try to do with any of our articles, click on the image to open a larger view.
Reading through the 7 annotations in numbered order, we realise that:
1) The price spike was not forecast immediately beforehand;
2 & 3) But there had been some clues
4 & 5 & 6 & 7) and indeed, if we look back far enough, there had been clues about the chance (but not certainty) of volatility a number of hours ahead!
… oh, and here’s the reference to Tripwire #1 and Tripwire #2, which are still in existence.
(B) Price was not the only thing with changed expectations!
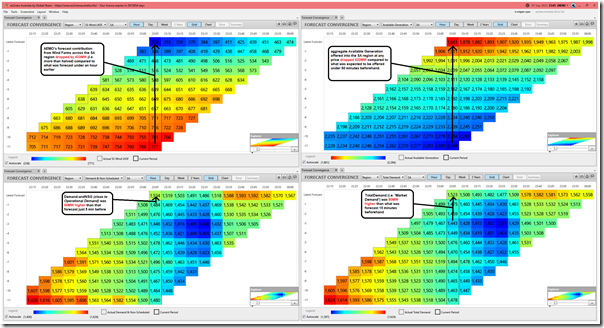
The power of the ‘Forecast Convergence’ widget in our ez2view software is that it’s not just limited to showing how price forecasts converge on reality – here’s four of the widgets in a single window each looking at different physical parameters used within NEMDE to dispatch the market:
As we can see highlighted in these images:
1) In the top 2 images, we see that the actual contribution possible from wind farms across South Australia was less than half of what it was forecast to deliver less than 60 minutes beforehand:
(a) and that this translated to a significant (433MW) reduction in aggregate Available Generation offered into the SA region at any price.
(b) a useful reminder of how forecasting contribution from renewables is not a perfect science, and sometimes it can be quite incorrect at short notice.
2) Coincident with that, we also see that the Market Demand and Operational Demand ended up noticeably higher than was forecast just a few short dispatch intervals beforehand.
This double-whammy clearly played some role in the price spike emerging when it did.
(C) Other factors, in the bid stack
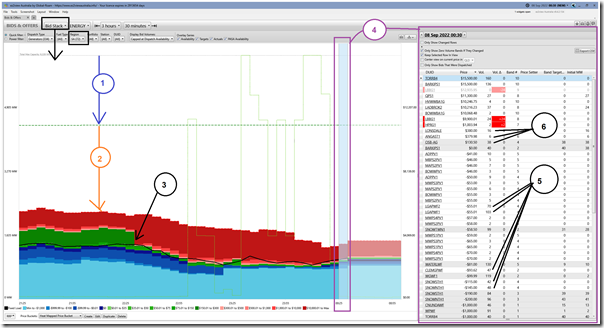
So for this third piece of the puzzle, we open up the ‘Bids & Offers’ widget in ez2view, but instead Time-Travelled to 00:30 (i.e. at the end of the volatility) looking backwards for the prior three hours, so we can see what happened through the price spike and also a short period beforehand as well – the price in SA has been selected to display as a reference point:
With respect to the coloured annotations on the image:
1) There’s a significant difference shown between aggregate Maximum Capacity (i.e. the installed capacity of all supply-side units) and the ‘PASA Avail’ (i.e. capacity available to generate, with some being only at the direction of the AEMO) – which represents capacity unavailable … remembering that shoulder months like September are normally ‘outage season’:
i.e. 6,228MW (MaxCap) – 4,444MW (PASA Avail) = 1,784MW (Unavailable)
2) Below this, there’s also a significant volume available to AEMO, but not bid into the NEMDE price forming process (which might be for various reasons):
i.e. 4,444MW (PASA Avail) – 1,411MW (bid into NEMDE at 00:30) = 3,033MW (available, but not priced)
PS with respect to this point, see Allan’s clarifying comment below.
3) I’ve specifically highlighted the 22:35 dispatch interval, because it’s in this dispatch interval that we see a significant volume of energy that was ‘bid in green’ repriced to prices above $10,000/MWh.
(a) In May 2019 via GRC2018 we noted about the reduced ‘volume bid in green’ as one of the indications of how ‘The Level of Risk in the NEM is increasing’ … and we expanded on this in December 2021 via GenInsights21 (as the pattern, and the level of risk, has not abated – in fact it has increased).
(b) What’s illustrated above is a period of time where, for various reasons, the ‘volume bid in green’ has almost completely disappeared…. no wonder we saw volatility through this period given the drop in wind capability, and rise in demand, noted above!
4) The ‘Current Bids’ table on the right is focused on the 00:30 dispatch interval.
5) We can see many different DUIDs that have volume offered in their bid files (i.e. ‘MaxAvail’ in the bid), but this is overwritten for Semi-Scheduled assets like those highlighted by their true capability … which we have noted in aggregate for wind farms above was actually much less than expected only an hour beforehand.
6) Combine that fact with the very small volume of dispatchable capacity offered between $0 and above $300/MWh (i.e. ‘volume bid in green’) and we see another illustration of why it was so susceptible to volatility.
So adding together the three pieces of the puzzle above, we’ve gone some way to understanding why the prices spiked ‘out of the blue’ (but not completely by surprise) early this morning.
I could do on and delve into bids for individual Fuel Types, or DUIDs, but think we might leave that for a ‘Part 3’ article later…. (perhaps).


Just on the discussion of PASA Availability:
“there’s also a significant volume available to AEMO, but not bid into the NEMDE price forming process (which might be for various reasons):
i.e. 4,444MW (PASA Avail) – 1,411MW (bid into NEMDE at 00:30) = 3,033MW (available, but not priced)”
Most of this difference (about 2,400 MW) relates to large scale wind and solar, for which PASA availability is usually shown as facility capacity before taking into account available wind and sun. However in most cases the difference between PASA and bid (market) availability for semi-scheduled plant is obviously not available to AEMO or to anyone else, because actual output is limited by wind and sun conditions.