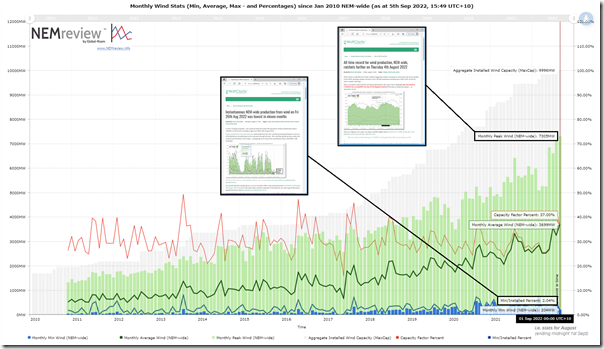
We’ve recently ticked over into Spring 2022 in the NEM and so I thought it would be useful to take stock of how aggregate production levels across wind farms spread across the NEM trended on a monthly basis up to and including August 2022:
This trend was produced using this pre-prepared trend in NEMreview v7, so those with their own licence can open here.
As highlighted in this image, the month of August saw both extremes of outcome:
1) On 4th August 2022 we saw a new record maximum reached for instantaneous production from wind:
(a) Up at 7,305MW;
(b) A contribution of Grid Demand being closer to 30% than 25%
(c) At 20:50 on that Thursday evening.
2) On Friday 26th August 2022 we saw the instantaneous production from wind drop to the lowest level in eleven months:
(a) Just 204MW;
(b) Just 0.98% if Grid Demand;
(c) just 2.04% instantaneous Capacity Factor across the total installed capacity base;
(d) Which appeared to be because of low wind conditions across almost all of the NEM (excepting far north Queensland).
—
In the chart above the other thing that jumps out at me straight away is:
3) That May, June, July and August 2022 showed stronger levels of production:
(a) New maximum points ratcheted up in May 2022, in July 2022 and several times in August 2022.
(b) Average levels up in June, July and August 2022 … above 30% in each of those months (but lower in May 2022);
(c) However monthly minimums were not really much different from months that came beforehand.
4) This followed the poorer months beforehand:
(a) Maximum levels during February, March and April 2022 being considerably lower than seen in the preceding months
(b) Average levels for March, April (capacity factor only 25.5%) and May (27%) being lower than most other months.
That’s all, for now…


Leave a comment