As noted here on the day, and updated since that time Wednesday 10th August 2022 was a curious event in the NEM that:
Step 1) saw a software upgrade to NEMDE that went awry
Step 2) result in a massive escalation for requirement for FCAS services
Step 3) resulting in significantly changed dispatch targets, and sky-high prices for 4 of 6 Contingency FCAS commodities across all regions, and
Step 4) then triggering a number of different participant responses – including (but not limited to) Wind Farms.
In discussions internally it is already proving to be a very useful reference point for some of the future enhancements we’re working on for our ez2view software.
(A) Quick background
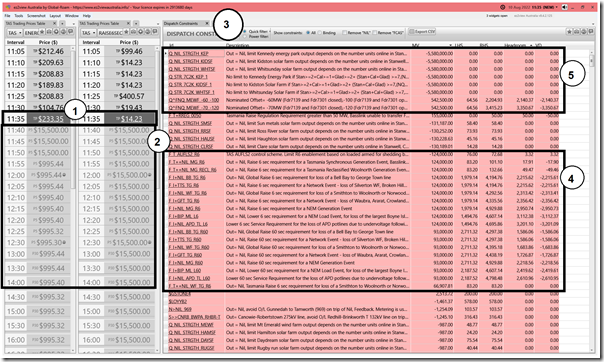
To provide some context to what follows in the article, note the following snapshot from ez2view time-travelled back to Wednesday 10th August 11:35 … which was the first dispatch interval in which (the software glitch meant that) prices went ballistic … particularly for (but not limited to) ENERGY prices in TAS and also Contingency 6sec and 60sec Raise/Lower across all five regions:
With respect to the numbering on the image above, note that:
1) As noted here, ‘actual’ prices for ENERGY and FCAS commodities were all revised from 11:35 through until 12:40 and what is shown in the image is the revised prices (massively lower);
2) But this process did not revise all the other data that was published as part of the (since declared erroneous) NEMDE run … such as the P5 and P30 predispatch price forecasts still shown here to be elevated.
3) Also not republished by AEMO for the ‘corrected’ NEMDE rerun was the series of constraint data, such as shown in the ‘Dispatch Constraints’ widget in ez2view here …
(a) keen readers will observe that the list of constraints shown bound (i.e. MV non-zero) is significantly longer than shown in this article published on the day,
(b) which is because there are a series of constraint equations here that were confidential on the day (i.e. because they only had a single DUID on the LHS) and are only now visible in time travel.
4) These bound constraints included a whole series of FCAS-related constraints, which was the underlying reason why the prices had spiked to the Market Price Cap for 4 different FCAS commodities.
5) Also highlighted are some of the constraint equations which (for System Strength or other reasons) were ‘constraining down/off’ the output of a number of Semi-Scheduled wind farms and solar farms at the time … unrelated to the NEMDE software glitch.
There are other things that could be noted in the above, but we’ll save that for another article.
(B) Responses at Wind Farms
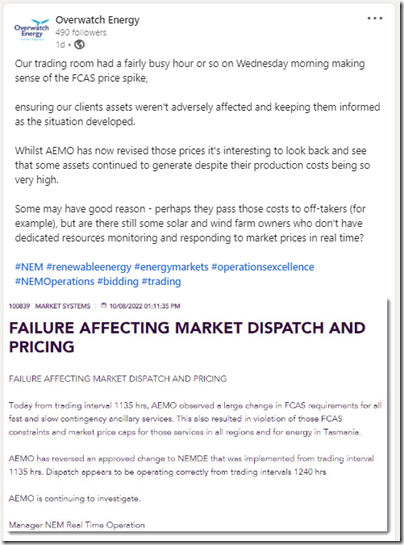
Last Friday afternoon (12th August) I noted that Overwatch Energy* had posted this update on LinkedIn:
* readers will remember that we provided some seed funding (amongst other initial shareholders) to kick-start Overwatch Energy only a couple years ago … and we’ve been quite pleased to see the stunning growth they have achieved since that time.
This update reminded me of the question Liam had asked at the end of my article on Wednesday – which was:
‘Digging in to this one, looks like generation at DUIDs CHYTWF1, STOCKYD1, MUWAWF1 and MUWAWF2 were suddenly interrupted. Do not know if these were the result of constraints binding (i.e. dispatched off), or there was some kind of fault in the area.’
Now I had added a quick response there without checking any details (which is always a risk!), and Allan then reminded us that there might be other reasons why DUIDs such as this might have responded as they did.
(B1) Caveats (important!)
So with the benefit of a bit of time on the weekend just passed, I thought I would have more of a systematic look across all Wind Farms Farms … noting that if time permitted I’d look at more than just them, and that I just started with Wind Farms because of Liam’s question on Wednesday.
Readers should keep in mind with what follows below that, whilst I have tried to ensure that I’ve not made any errors in what follows, it’s entirely plausible that either/both:
1) I may have made errors in the interpretation of what happened (and importantly why); and in particular that
2) Individual participants may well have other reasons I am unaware of for performing as they did through this period.
Hence readers are cautioned to keep this in mind in reading the following…
(B2) High level reasons for response
This article focuses just on Wind Farms … but readers should keep in mind that all participants (supply-side and consumption-side) will have been affected by what happened – both:
1) With respect to the sky-high prices published at the time … which has affected behaviour in a number of ways; and also then
2) With respect to the much lower (revised) prices subsequently published to over-write the above … as a result of which participants may well be feeling that there were opportunities foregone (and/or additional costs incurred) as a result of the erroneous dispatch process (time will tell if there are compensation claims made as a result of this).
With this in mind, it’s useful to flag that responses might have occurred for several reasons, including the following:
Reason 1) There may have been responses unrelated to the software glitch … such as for system strength or other reasons;
Reason 2) There may have been responses as a result of the revenue opportunity in the ENERGY or FCAS markets … though there are not many Semi-Scheduled units participating in the FCAS markets currently.
Reason 3) There may have been responses due to avoidance of high FCAS costs … keeping in mind (as described here) that all supply-side units pay for Contingency Raise FCAS costs on a proportionate basis, and that R6sec and R60sec were published as being at the Market Price Cap for those 13 dispatch intervals across all regions.
(B3) Tabulated responses for all Wind Farms
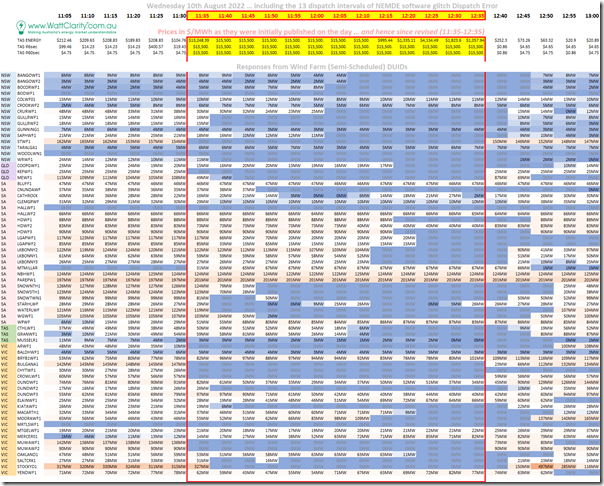
I’ve tabulated the trend of Dispatch Target for each of the Semi-Scheduled (or operating like Semi-Scheduled) Wind Farms across the NEM, sorted by Region and then alphabetically by DUID – and have colour-coded the cells to make the individual measure and timing of response somewhat easier to see.
The table’s probably not too readable inline here, but click on the table and it will open larger size in another window.
With respect to the table above, we see that a number of different types of timing of responses are apparent – which I would sum up as follows:
Response Type #1) Offline from 11:35
These wind farms were dispatched down at the start of the price volatility (coincident with the first spike).
My up-front hypothesis is that these DUIDs were constrained down as a result of being involved in the FCAS constraints that were bound/violated … or for some other constraint (possibly unrelated to the software glitch). The reason for this hypothesis is that bids for this dispatch interval needed to be submitted to the AEMO by ‘gate closure’ prior to the start of the dispatch interval … hence could not factor in any response (automated or otherwise) in response to the unexpected advent of high prices.
Response Type #2) Offline from 11:40
There are a number of DUIDs that were targeted offline from 11:40 (i.e. the second dispatch interval of the spike in contingency prices).
My up-front hypothesis is that these wind farms were automatically rebid to be dispatched down immediately in response to the high contingency FCAS prices (or perhaps with very quick manual intervention).
Response Type #3) Offline in the subsequent dispatch intervals
These wind farms were dispatched down in the dispatch intervals that followed, but before 12:35 … in the table above we can see a range of response times.
My up-front hypothesis is that these DUIDs were manually rebid to be dispatched down in response to the high contingency FCAS prices … with the possibility being that these ‘longer than 1 x DI delay’ being:
3a) The result of the manual processes; and/or
3b) Possibly taking into account more complex co-optimisations of cost/revenue/risk considerations (e.g. remembering that ENERGY prices were elevated in TAS and also other regions for some of this time).
Response Type #4) No response
There’s another bundle of DUIDs that don’t seem to have any response to the high Raise Contingency FCAS prices across all regions. As per the Caveat above, there may be various reasons why this was the case, including:
4a) Unaware of the cost of high contingency FCAS events; or
4b) Aware of the high cost, but willing to run through this in return for some other benefit.
(B4) Discrete Wind Farms
There are 67 x Wind Farm DUIDs listed in the table above.
Looking through many of the rows (working top-to-bottom) many DUIDs that caught my eye for various reasons – so I invested some time over the past weekend to have more of a look. Time constraints meant that I limited the number to only 19 of the 67 total number (under 30% of the full number).
Readers should not read much into those which have been selected, and those that have not – it’s merely been those that caught my eye (and with a desire for a bit of geographical diversity).
In what follows I have used the ‘Unit Dashboard’ widget in ez2view (and in some case additional widgets as well) to look specifically at the response, I was keen to explore the extent to which my up-front hypothesis appears to be correct:
NSW Region = BANGOWF1
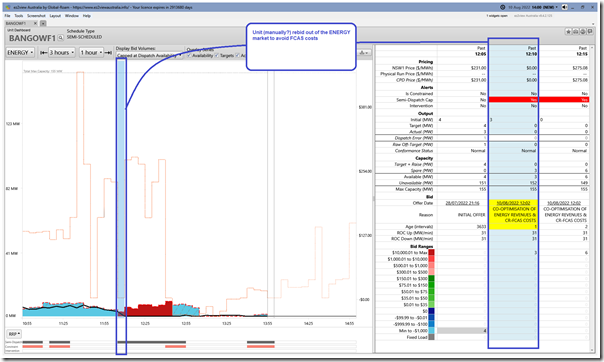
Top of the tabulated list above was BANGOWF1, which submitted an (apparently manual) rebid for the 12:10 dispatch interval noting ‘co-optimisation of energy revenues & CR FCAS costs’ to bid its capacity into the top bid band and so be dispatched down from that point. The unit had its capacity down at –$1,000/MWh prior to that point:
Hence this seems to fit into my hypothesis for Response Type #3.
In this particular case I have chosen to show the ‘final’ NSW dispatch prices that applied after the price revisions were applied … not that the unit being offline meant that there was revenue foregone with ENERGY prices up to $280.12/MWh over that period.
NSW Region = COLWF01
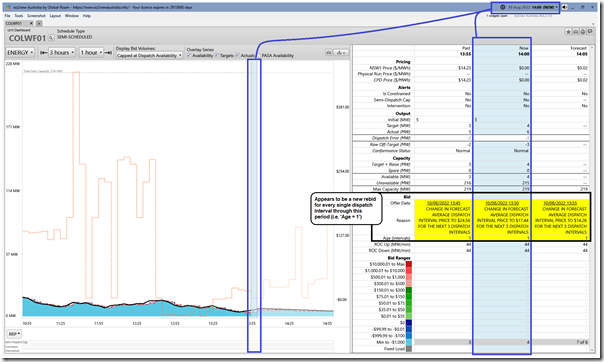
A useful contrast to the above was the COLWF01 which shows no change in behaviour through the period (as an interesting added observation, this unit appears to have an auto-bidder deployed, with this auto-bidder submitting a rebid every single dispatch interval through this period – but none of them materially changing the dispatch):
Hence this seems to fit into my hypothesis for Response Type #4.
NSW Region = GULLRWF1
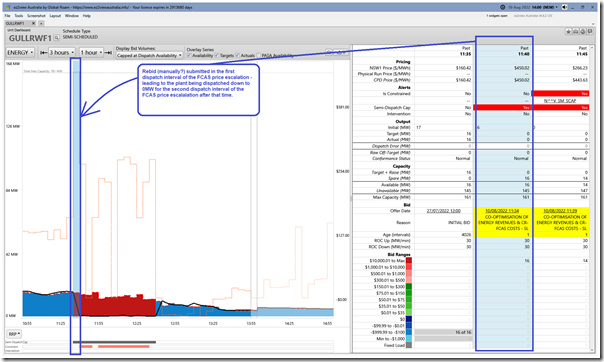
Here’s the same snapshot for the GULLRWF1 unit:
Hence this seems to fit into my hypothesis for Response Type #2.
Interesting, the image shows how the ‘N^^V_SM_SCAP’ constraint equation began to be bound in the following dispatch interval … but this appears not to have had any effect, with the DUID being bid out of the money anyway.
NSW Region = STWF1
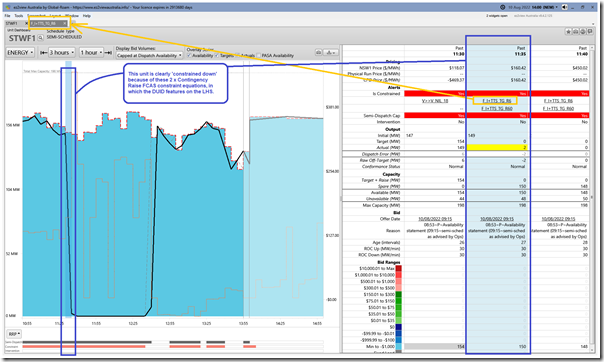
This unit appears to be a case in point for my hypothesised Response Type #1, so I was keen to have a look through two different images in ez2view:
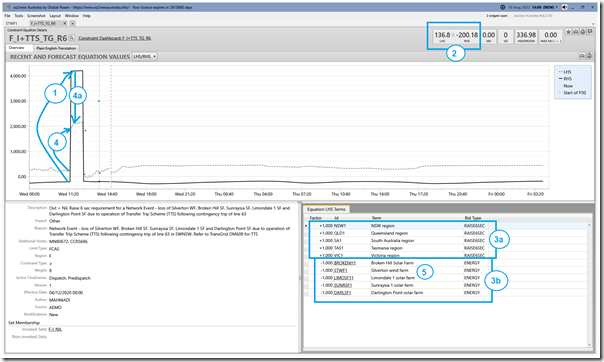
Starting with the ‘Unit Dashboard’ widget, we see that the unit was ‘constrained down’ from the first dispatch interval … as a result of two different (FCAS-related) constraint equations, with one being ‘F_I+TTS_TG_R6’ constraint equation. Clicking through to the ‘Constraint Dashboard’ widget for that constraint, we can begin to see why:
With reference to the numbered annotations:
1) The NEMDE software glitch results in the RHS sky-rocketing from –204MW (at 11:30) to 4,194MW (at 11:35)
2) This constraint is of the form LHS >= RHS … which is a common form for FCAS constraints and a couple of others.
3) The LHS is made up of both:
(a) Sum of the RAISE6SEC enablement levels across the mainland region;
(b) Minus the dispatch targets (in ENERGY) for five different Semi-Scheduled units, including STWF1.
4) We can see that the LHS valiantly rises to a massive 1,979MW (at 11:35):
(a) But this is still well below the RHS (erroneous) requirement;
(b) So the constraint is violated
5) As such, we can understand why this constrain had the effect of ‘constraining off’ STWF1 and the other four units (which are Solar Farms, so not covered in this iteration of the Case Study).
6) Food for another article later down the track is wondering what would have happened to system frequency if some sudden drop in frequency had been experienced and a huge overkill amount of contingency Raise had all been remotely triggered by virtue of these enablement levels?
Even moreso than for the other DUIDs noted above (i.e. because of higher volume foregone) there’s a lost revenue opportunity represented here.
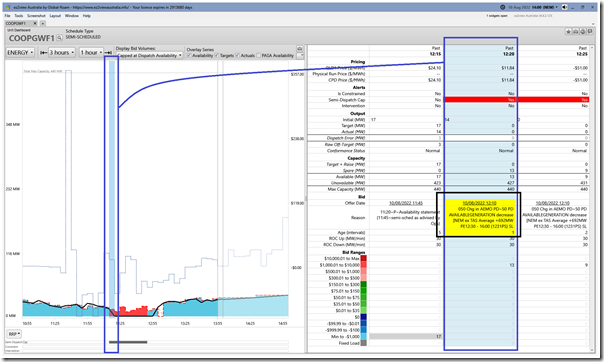
QLD Region = COOPGWF1
This unit appears to be a case in point for my hypothesised Response Type #3, so I was keen to have a look through ‘Unit Dashboard’ in ez2view:
As we can see here, there is a rebid that leads to the unit being ‘dispatched down’ – but in this case:
1) Not until the 12:20 dispatch interval; and
2) For a rebid reason that does not reference high contingency FCAS prices.
If I had more time, I’d think more about this…
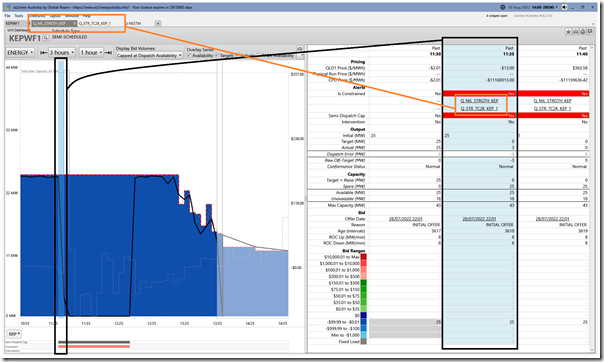
QLD Region = KEPWF1
This unit appears to be a case in point for my hypothesised Response Type #1, so I was keen to have a look through three different images in ez2view (which confirms my hypothesis, but for different types of constraints than the FCAS constraints noted above):
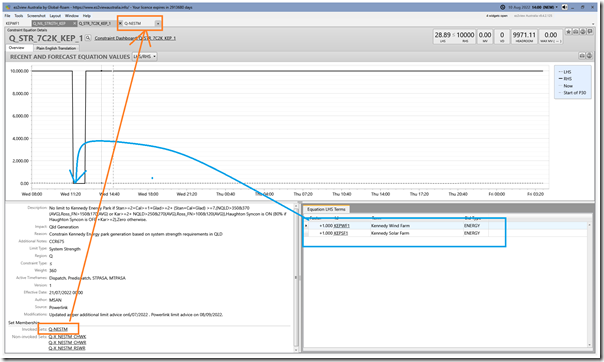
There are two different constraint equations acting to wind KEPWF1 downwards – the constraint ID for each suggests both are related to System Strength:
1) The ‘Q_NIL_STRGTH_KEP’ (which is ‘System Normal’, so always invoked) wants to wind the aggregate output of KEPWF1 and KEPSF1 to 25MW; but
2) The ‘Q_STR_7C2K_KEP_1’ constraint equation is more severe, in this case winding the aggregate output of KEPWF1 and KEPSF1 to 0MW … hence being offline.
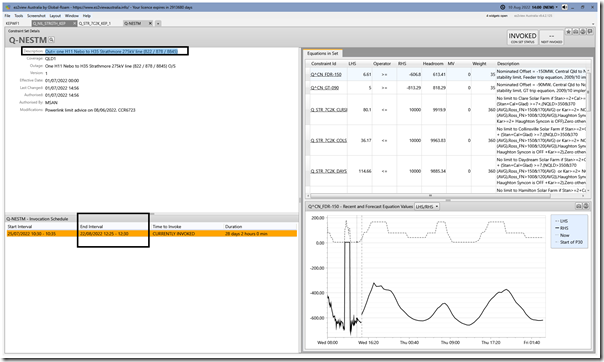
This second constraint equation is a member of the ‘Q-NESTM’ constraint set, which is related to ‘Out= one H11 Nebo to H35 Strathmore 275kV line (822 / 878 / 8845)’ and is continuing through until 22nd August 2022 (or at least was scheduled that way on Wednesday 10th August 2022):
SA Region = CNUNDAWF
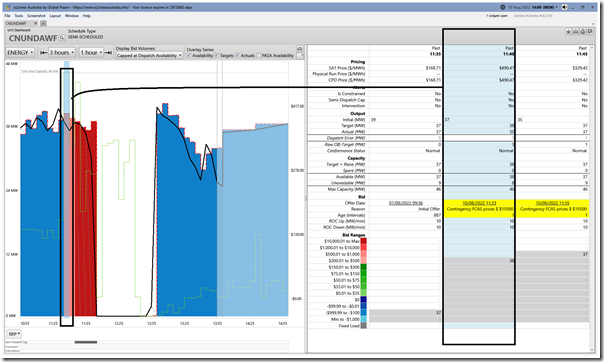
With reference to the summary table above we see that Canunda WF is not offline till a few DIs past the first spike in FCAS prices, so I wondered if this was aligned to hypothesised Response Type #3, and had a look.
Here’s a view of the ‘Unit Dashboard’ widget in ez2view with the table focused back at 11:40:
In this snapshot we see that a rebid was submitted referencing the high contingency FCAS prices and that volume had been shifted to the $300-$500/MWh bid range … however we also see that:
1) The dispatch target was not reduced;
2) The image above (with the revised prices) shows the RRP was $490.47/MWh … but at the time of dispatch the erroneous price was set at $1,195.34/MWh (i.e. well above the price bid by this unit).
…. hence it’s understandable why the unit was not dispatched down.
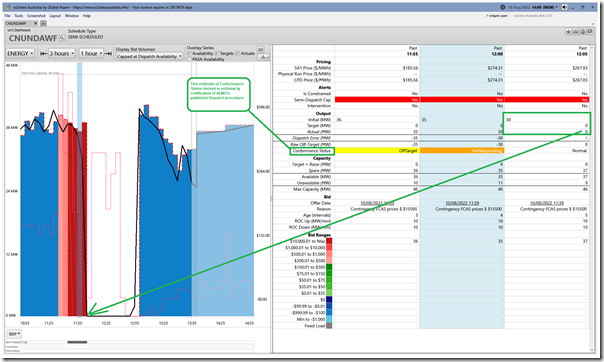
The window above shows that the volumed was shifted higher still for the 11:45 dispatch interval:
1) To the $500-$1000/MWh bid price range
2) But with the erroneous price initially set to be 1,853.20 for the 11:45 dispatch interval, there is still no reduction in target.
From this point the volume is shifted further upwards from the 11:50 dispatch interval, resulting in the Dispatch Target being driven to 0MW – however the unit is not offline till the 12:05 dispatch interval:
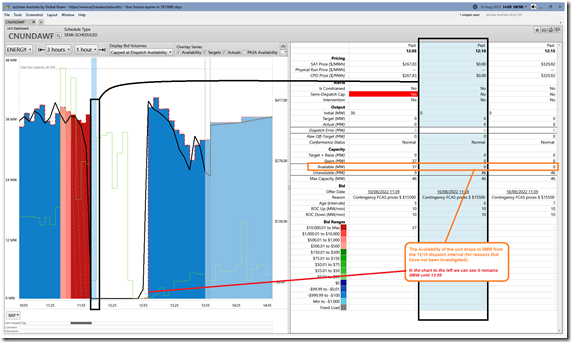
A final snapshot for CNUNDAWF focused on the 12:10 dispatch interval shows the Availability drop to 0MW … where it remains until the 13:05 dispatch interval:
SA Region = HDWF1
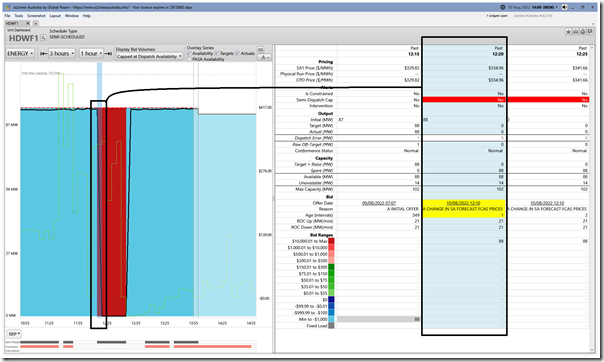
In the case of HDWF1, a rebid was received by AEMO at 12:10 and first used in NEMDE at ~12:15 for the 12:20 dispatch interval:
It references ‘a change in SA forecast FCAS prices’ and shifts volume toward the top of the pricing stack, delivering a 0MW target for the 12:20 dispatch interval.
Remember that HDWF1 is one of the few wind farm units providing Regulation FCAS services – I have not checked what was published for forecast Regulation FCAS prices at the time … it might have been that this rebid was with reference to regulation FCAS prices (i.e. potential revenue for the unit) and not contingency FCAS prices (i.e. a cost to the unit).
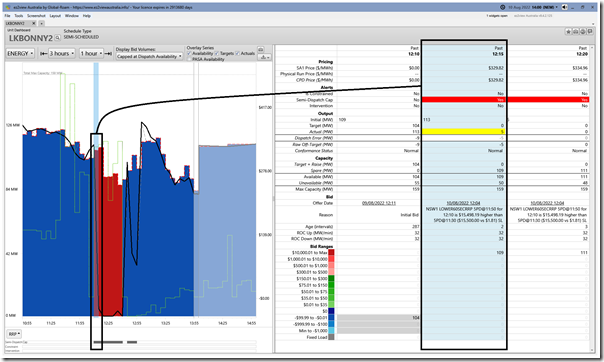
SA Region = LKBONNY2
Of the three units at Lake Bonney wind farm, I selected unit 2 to look at:
In the snapshot above, with the table focused on the 12:15 dispatch interval, we see:
1) Volume shifted to a higher-priced bid band (it had been at a ‘negative LGC’ style bid band) in a rebid received by AEMO at 12:04 and used in NEMDE at ~12:10 for the 12:15 dispatch interval;
2) Which results in dispatch target reduced to 0MW.
3) What jumped out at me was that the rebid reason references NSW Lower 60SEC price … which is clearly not the region pertaining to this asset (and, as noted above, I would have thought Contingency Raise more relevant from a cost minimisation perspective).
(a) I’m guessing that there was a rebid for multiple units in the portfolio, of which LKBONNY2 was only one;
(b) But have not invested time to explore further and possibly confirm my guess.
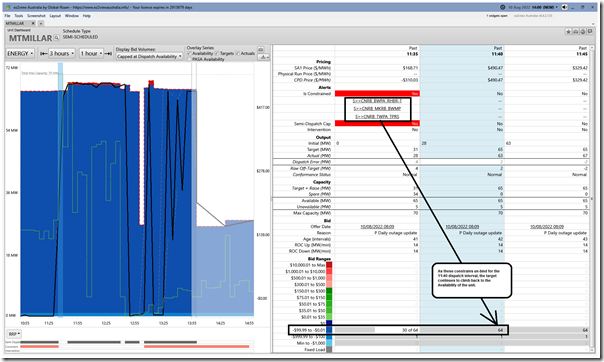
SA Region = MTMILLAR
With the MTMILLAR unit, the summary table above showed that the unit had significantly increased output over the period seeing high Contingency FCAS costs, so I was curious to have a look:
The ‘Unit Dashboard’ window for the unit is focused on the 11:40 dispatch interval, and also shows the 11:35 dispatch interval beforehand:
1) The earlier interval showed the unit subject to three separate bound constraint equations:
(a) The ‘S>>CNRB_BWPA_RHBR-T’ constraint equation … which is a member of the ‘S-CNRB’ outage-related constraint set.
(b) The ‘S>>CNRB_MKRB_BWMP’ constraint equation … in the same set.
(c) The ‘S>>CNRB_TWPA_TPRS’ constraint equation … again in the same set.
2) As these constraints unbind in the 11:40 dispatch interval, the Semi-Dispatch Cap lifts and the unit receives a Target to ramp back to its full 65MW Availability.
3) Not visible in the image above …:
(a) these equations had delivered the unit a ‘CPD Price’ down at –$626.94/MWh in the 11:30 dispatch interval, which was below the units bid prices and so the unit had been fully ‘constrained off’ up until that point;
(b) from the 11:35 dispatch interval (coincident with other plant bidding themselves out of the market) the CPD Price for MTMILLAR begins to rise (to –$310.03 at 11:35) as a result of which the unit receives a target to start generating
(c) which just happens to be coincident with R6 and R60 prices jumping to the MPC as first published
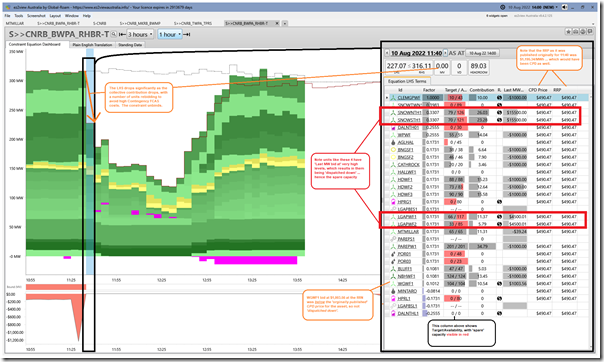
4) The snapshot below, from the (in development) ‘Constraint Dashboard’ widget in ez2view is focused on the ‘S>>CNRB_BWPA_RHBR-T’ constraint equation at the 11:40 dispatch interval and shows what collectively happened:
… particularly:
(a) Units such as SNOWNTH1, SNOWSTH1, LGAPWF1 and LGAPWF2 all having spare capacity because they have rebid volume to higher priced bid bands … above the CPD Price that would have been originally published for these units of $1,195.34/MWh
(b) Leaving the volume at MTMILLAR (still bid at –$39.24/MWh) to be fully dispatched … and even WGWF1 as well (also bid below the CPD price).
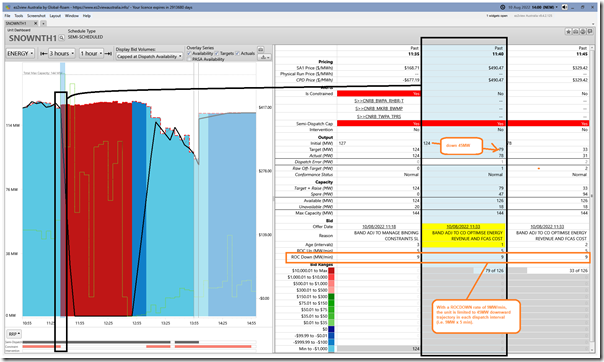
SA Region = SNOWNTH1
Following from the above, here’s a quick look at SNOWNTH1:
As noted, there was a rebid received by AEMO at 11:33 and used at ~11:35 for the the 11:40 dispatch interval which moved all volume ‘out of the money’. However the ramp down was limited by the slower ROCDOWN rate (compared to other Wind Farm units) of 9MW per minute.
SA Region = SNOWTWN1
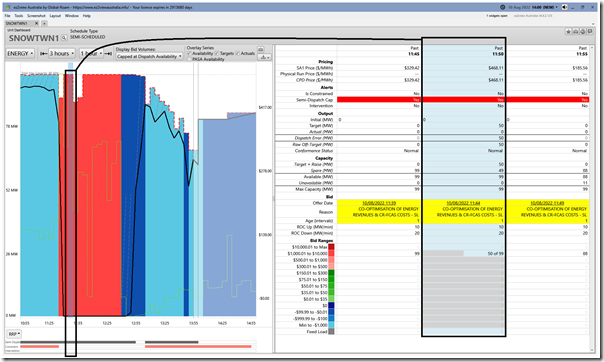
With respect to the older SNOWTWN1 unit, there’s two things worth noting:
1) A rebid was placed at 11:34 for the 11:40 dispatch interval referencing ‘co-optimisation of energy revenues and CR-FCAS costs’ to move volume ‘out of the money’ … which resulted in the unit being fully dispatched down in that dispatch interval with a higher ROCDOWN rate of 20MW/minute;
2) What’s shown below is the curious case of the 11:50 dispatch interval, where the following seems to occur:
(a) The unit receives a Target to ramp up to 50MW (i.e. limited by it’s ROCUP rate of 10MW/min)
(b) This appears to be because the prior rebid shifted volume ‘only’ to $5,001/MWh … and the ‘as published’ RRP for the SA region for 11:50 (hence the CPD Price for SNOWTWN1 given no constraints) was $5,140.45/MWh … i.e. above the bid price, explaining the dispatch instruction.
(c) But the ‘FinalMW’ for the interval shows its actual output still at 0MW for unknown reasons.
SA Region = STARHLWF
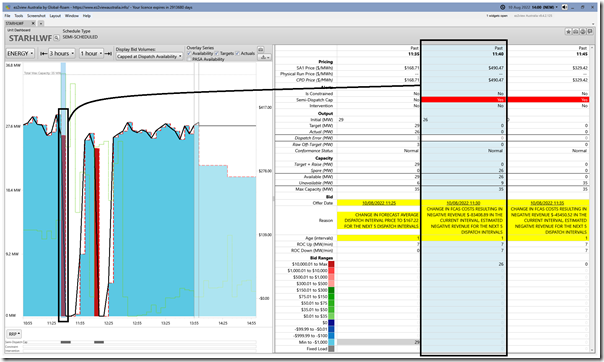
In the table above this unit is a curious case of dropping to 0MW in the 11:40 dispatch interval, but then rising again through the middle period before dropping back to 0MW again whilst FCAS prices were still high.
This aroused my curiosity, so I had a look – here are two snapshots of the ‘Unit Dashboard’ widget in ez2view, with the first one focusing on the 11:40 dispatch interval in the table:
In this case we see what appears to be an automatically submitted rebid that references a calculated net revenue position (i.e. Revenue minus FCAS costs) that would have been substantially negative at the time – leading to the unit being repriced high and hence being dispatched to 0MW.
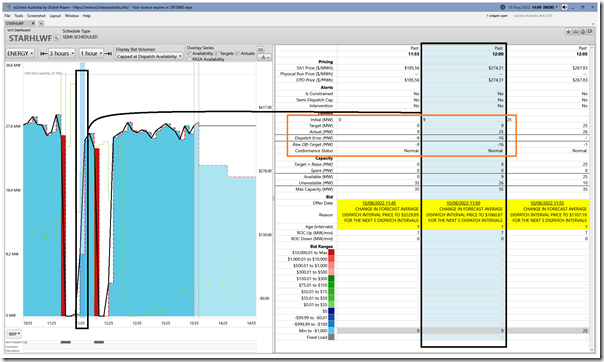
Next we move the context of the table to show the 12:00 dispatch interval:
At this time, the FCAS R6 and R60 contingency prices (as they were published) are still sitting at $15,500/MWh – but the rebid reason no longer references contingency FCAS prices and instead only forecast ENERGY prices. I’ve not had enough time to think this one through to understand why the difference in approach…
TAS Region = GRANWF1
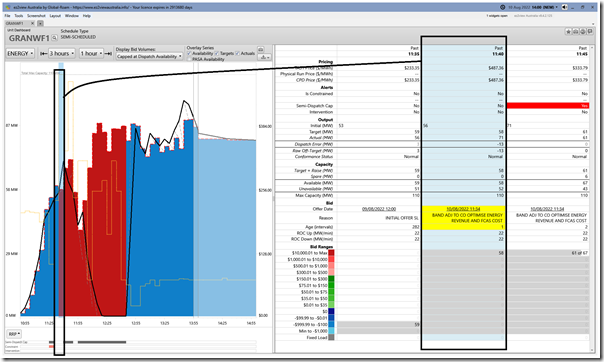
Looking into the summary table above, I was initially of the view that this fit into my hypothesised Response Type #3 (i.e. manual rebid response a bit later), but it appears that I was incorrect in this instance.
In the ‘Unit Dashboard’ widget from ez2view above we can see that the rebid was submitted for the 11:40 dispatch interval (and there’s a fair chance this was automated – hence Response Type #2.
But the unit’s target does not immediately start to decline, so I scratched my head to wonder why…
1) It occurred to me that the published price for ENERGY in TAS at 11:40 was initially for it to be at the Market Price Cap
2) So even though the participant tried to get out of the way, by bidding volume up to the Market Price Cap, a general scarcity of generation in TAS (remembering many hydros were backed off to provide the astronomical FCAS requirement) drove the ENERGY price high as well and meant that GRANWF1 was not allowed to reduce output in its target.
3) In hindsight the unit’s probably happy it was able to run for a few more dispatch intervals before being constrained off, as the ‘final’ ENERGY prices appear favourable… especially with ‘final’ FCAS prices low.
What a strange day for that unit!
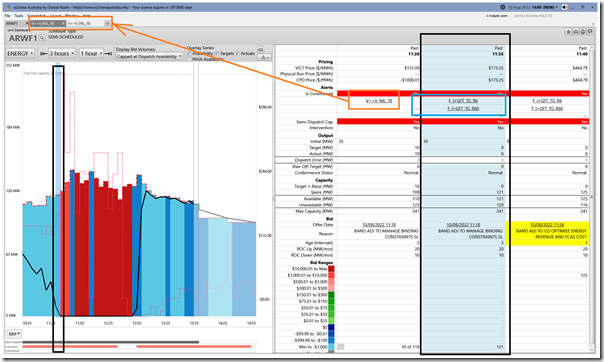
VIC Region = ARWF1
Based on the data in the summary table above I was a little uncertain at making a hypothesis about what approach this unit was taking … as (whilst the unit was dispatched to 0MW from 11:35) it appeared that the unit was actually trending down before that point.
So I had a look in the ‘Unit Dashboard’ widget in ez2view:
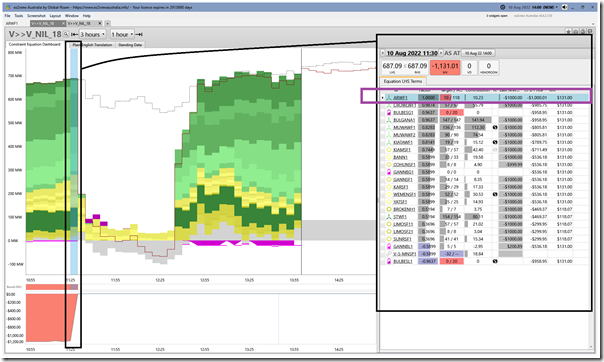
Turns out that this unit was already being ‘constrained down’ by the ‘V>>V_NIL_18’ constraint equation prior to the 11:35 contingency FCAS price aberration. Here’s a view of the 11:30 dispatch interval in the ‘Constraint Dashboard’ widget in ez2view, which shows the unit only being dispatched to 10MW of the 180MW offered (down at –$1,000/MWh) in that dispatch interval:
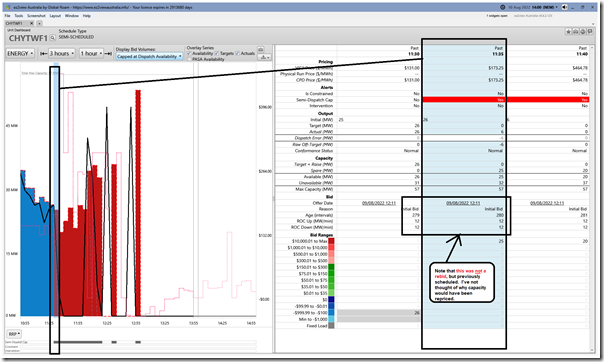
VIC Region = CHYTWF1
In his question here, Liam named 4 particular wind farms, including this one – so I thought I would have a particular look. From the summary table above it appears that the unit (which was dispatched down from 11:35) fitted into my hypothesised Response Type #1, but it appears that I was incorrect in this instance.
Here’s the ‘Unit Dashboard’ widget in ez2view:
At this cursory level of analysis (HINT – I might have missed something!), it appears to be entirely a coincidence that the bid submitted hours beforehand had scheduled to reprice capacity up in the highest price bid band … thereby saving the unit from the high contingency FCAS costs that were published from 11:35.
What a coincidence!
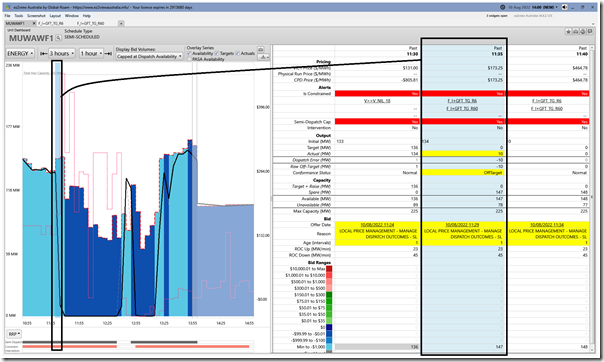
VIC Region = MUWAWF1
In his question here, Liam named 4 particular wind farms, including both MUWAWF1 and MUWAWF2 – so I thought I would have a particular look at unit 1.
Here’s the ‘Unit Dashboard’ widget in ez2view:
In this case we see that it is correctly my hypothesised Response Type #1 (i.e. being ‘constrained down’ because of Contingency FCAS constraints for R6 and R60.
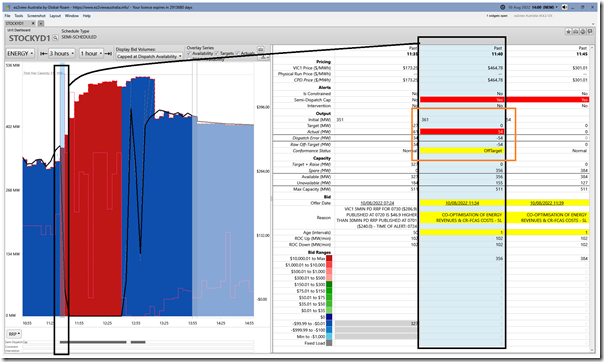
VIC Region = STOCKYD1
In his question here, Liam named 4 particular wind farms, including this one – so I thought I would have a particular look at unit 1. Even from a quick scan of the summary table above it appears that the unit (which was dispatched down from 11:40, and fully off from 11:45) fitted into my hypothesised Response Type #2 or Type #3, so it turns out my response on Wednesday’s comment (i.e. assuming Type #1) was incorrect in this instance.
Here’s the ‘Unit Dashboard’ widget in ez2view:
This closer look seems to confirm my hypothesised Response Type #2…. but with a slightly slower response down (note the ‘Off-Target’ derived Conformance Status) than AEMO had dispatched for. I’ve no knowledge of any reason for this.
Whew, that’s 19 of 67 Wind Farms, and already it’s a long article…
(C) Responses by Solar Farm
This will have to be another Case Study at another time…


Leave a comment