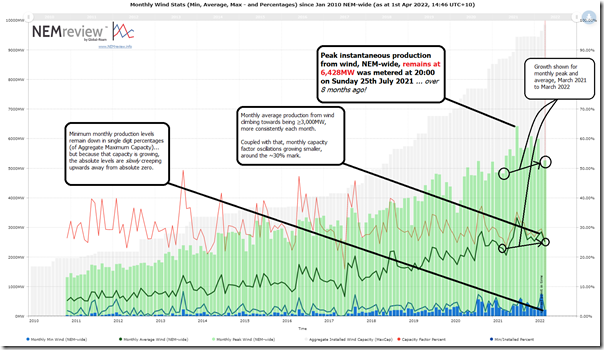
It’s 1st April 2022, and I have not checked these stats in NEMreview v7 for a while, so I thought I would have a quick look at how a number of the key stats are trending:
Quick notes about statistics:
1) Not annotated on the chart above, is the climb in installed capacity climbed in February 2022 to be 9,469MW (adding Murra Warra stage 2 Wind Farm) and further in March 2022 to be 9,850MW aggregate Maximum Capacity (adding the Port Augusta Wind Farm). So not far off the 10,000MW mark, now.
2) In terms of the actual output levels – aggregated across the NEM:
(a) As highlighted on the image, the monthly maximum output across all of this capacity remains at the level of 6,428MW set at 20:00 on Sunday 25th July 2021.
i. That’s over eight months ago now, which reinforces the seasonal production shape (winter heavy) of wind harvest patterns in the current fleet.
ii. I’ve highlighted the growth in monthly peak output from March 2021 (4,825MW) to March 2022 (5,272MW – so up 447MW).
(b) In terms of monthly averages, we also see this grow from March 2021 (2,286MW) to March 2022 (2,514MW – so up 228MW).
it’s also worth noting that, in volumetric terms, the monthly capacity factor across the whole fleet is showing progressively less deviation each month, and settling around a level of around 30% NEM wide.
(c) Finally in terms of monthly minimums, we see that they are consistently in the single digit percentages of installed capacity.
i. Because of the growth in installed capacity, in absolute terms the minimum levels are slowly creeping upwards;
ii. March 2021 (199MW) grew to 216MW in March 2022, for instance … i.e. up, but only by 17MW.
iii. Glass half full, or glass half empty?
—
For those participating in our briefing about GenInsights21 for the Smart Energy Council next Tuesday, we’ll invest a small portion of the time to expand on the above by talking through what’s explored in Appendix 27 within GenInsights21 ‘Exploring Wind Diversity’. See you there!


Leave a comment