It’s not supposed to be until Tuesday (i.e. tomorrow) and Wednesday this week that the supply-demand balance is really going to be stretched, but that did not stop a decent run of spot price volatility occurring on Monday evening 31st January 2022!
The volatility is ongoing, even as I post this article (~19:10 NEM time).
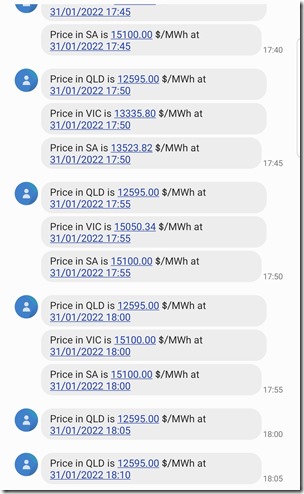
This run began in the 16:30 dispatch interval (NEM time) with prices spiking to ~$1,200/MWh in VIC and SA … and particularly escalating from 17:30, and with QLD joining the party from 17:50 at which point the prices for all 3 regions were well above $12,000/MWh. Here’s a snapshot of some of* the pricing excursions captured by SMS alerts at the time:
* there are too many SMS alerts to fit into a single image on my phone, so this is just what I managed to grab in the middle of the pricing run.
(note that SMS alerts are configurable in a number of our software products – ez2view, deSide® and NEMwatch)
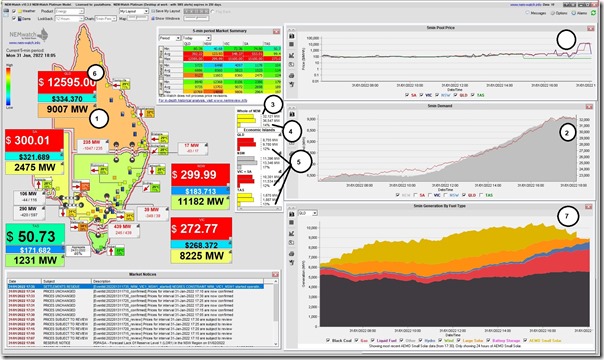
Of these spikes, this snapshot from the installed NEMwatch dashboard captured more of what the state of the market was like at the 18:05 dispatch interval:
At some point when the week is done, we’ll hope to find the time to post a broader review of activity through the week … so for now it is worth highlighting a couple things per the annotations here:
1) The QLD ‘Market Demand’ at this point (9,007MW) is well up in the ‘orange zone’ with reference to the historical range of demand experienced in the QLD region since the start of the NEM
… this is still 1,000MW below the all-time maximum set at 10,052MW in the 16:55 dispatch interval on Wednesday 13th February 2019.
2) We can see in the trend chart that the QLD demand had been in excess of 9,000MW since the 16:55 dispatch interval (at 9,062MW).
3) NEM-wide ‘Market Demand’ demand above 32,000MW:
(a) the highest point today was up at 32,534MW at 17:30 (what’s shown at 18:05 is 32,121MW in the snapshot above)
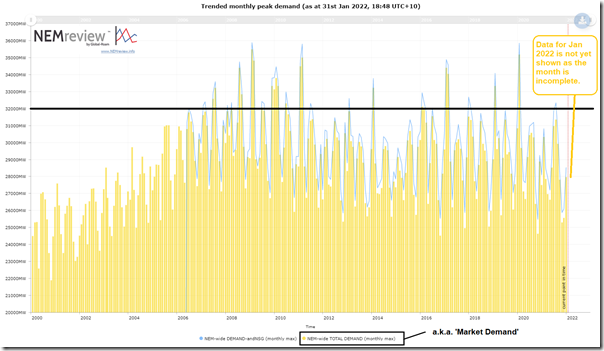
(b) using this pre-prepared query in NEMreview v7 online, I’ve quickly produced this trend of monthly peak for NEM-wide ‘Market Demand’ to highlight how few months there have been where this metric peaks over 32,000MW:
(c) Given what we uncovered in Appendix 15 within the GenInsights21 report we released just over a month ago, it does not surprise us at all that NEM-wide demand does remain stubbornly high, at peak times.
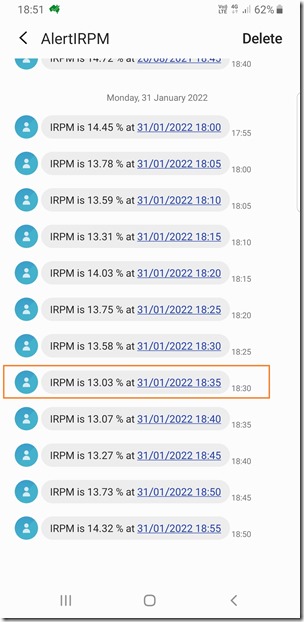
4) On a NEM-wide basis, we see a colour-coded alert at yellow level because the NEM-wide IRPM (Instantaneous Reserve Plant Margin) has dropped below 15% … which it does quite rarely.
(a) The IRPM highlights the general level of tightness between supply and demand (and rarely drops below 15% on a NEM-wide basis).
(b) This string of SMS alerts, recorded separately, shows some of the trend this evening – with the lowest point in the range shown down at 13.03% in the dispatch interval ending 18:35:
5) Furthermore, in terms of the ‘Economic Islands’ formed by the constrained interconnector flows, the more localised IRPM levels had hit ‘red alert’ levels (i.e. below 12%) for both QLD and VIC+SA, providing a non-price indicator of the scarcity of the supply/demand balance.
6) In this particular dispatch interval the QLD dispatch/trading prices has remained up at $12,595/MWh – but the prices for VIC and SA have fallen back to be ‘only’ $300/MWh or so (joining the NSW price there). The TAS price has been subdued this whole time, limited by Basslink export capability.
7) On the right there is the fuel mix for the QLD region, showing the ramp up of gas-fired generation (and the limited hydro capacity currently in the state) to take over from solar generation as it approaches bedtime. With respect to the fuel mix, for those on Twitter, these added links will provide a bit more context:
(a) Another snapshot from NEMwatch shown here highlighting declining supply from Wind and Solar (both small and large) coincident with the spikes; and
(b) Coincident discussion thread involving a number of people concerning modelled results of a hypothetical future renewable-dominant grid (which we also modelled in some detail in Appendix 27 within the GenInsights21 report).
—
Stay tuned for more fireworks in the next couple days…


Leave a comment