Second article in the new Five Minute Settlement world … and not half so early in the morning as the first one was!
We’ve a couple reasons to have a look at what bid data is visible to us today, on Saturday 2nd October 2021, including two big ones:
1) First and foremost, because the first real 5-minute bids for Friday (being a ‘Private in Real-Time but Next-Day-Public’ data set) were only visible to the broader market from 04:00 this morning.
2) Another reason was the major investment we made in revamping the ‘bids analysis’ function in ez2view for our recent v9.1 release for 5MS … a version upgrade that we’ve started receiving some big compliments for, from happy clients:
(a) We’ve already started to look towards the next release … which we might call v9.2, and which will work successfully with the Wholesale Demand Response Mechanism:
i. The WDRM relies on the accompanying MMS v5.1 … which only goes into production at the same time coincident with the market going live; and
ii. The WDRM also introduced Tripwire #3, which we’ll be ensuring v9.2 successfully navigates.
(b) Hence it was natural to have a quick look today, after the first full day of 5MS bids becomes available.
3) There are other reasons as well…
—
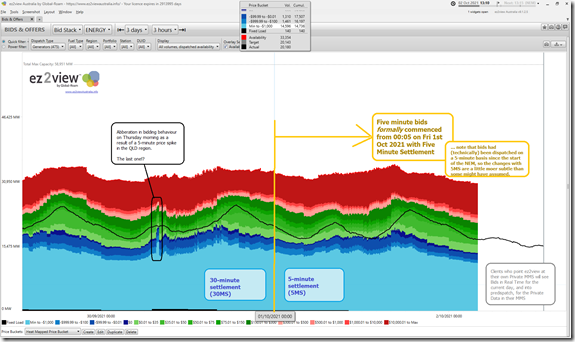
Here’s a snapshot from ez2view v9.1 ‘Bids & Offers’ widget from early this afternoon, zoomed in to only look over the last 3 days, and only looking at bids for ENERGY (bids for FCAS available, but not so much of a curiosity in this article):
As you will have seen in prior articles here:
1) we typically use a default bid range colouring with four primary colours:
(a) BLACK (or sometimes GREY) = for Fixed Load,
(b) BLUE for $0/MWh and below,
(c) GREEN for short run marginal cost, and
(d) RED for above cap trigger (i.e. $300/MWh)
2) … which are the same colours also used in the Generator Statistical Digest 2019, for instance (and will also be used inside the GenInsights21 upcoming release).
3) Though ez2view clients can establish their own.
—
I’ve added the divider on the chart at 00:05 on Friday 1st October to mark the commencement of Five Minute Settlement … and readers might note that two obvious points jump out:
Observation 1) Not a radical shake-up
Depending on what you were expecting with the start of 5MS, you might be surprised to note that there’s NOT been any radical shake-up in where volumes have been allocated, at least at this early stage.
Part of the reason for this is that the NEM has always been dispatched on the basis of five minute bids (in practice), what’s changed are some rights and responsibilities for Registered Participants in terms of how they structure these bids.
—
Time will tell, in terms of what evolves … which means our envisaged release date for GenInsights21 (at the start of December) might be a very good time to publish a more focused review of the first 2 months … and prior to the start of summer 2021-22 (overlapped with the ordinarily volatile Q1 for 2022).
Observation 2) Last gasp of 5/30 behaviours
We can clearly see, however, the ‘last ever?!’ case of ‘race to the floor’ bidding … at least as a result of the 5/30 issue. This is visible even when bids are ‘zoomed out’ to show the stack on a NEM-wide basis for the chart above.
With the power of ‘Time-Travel’ in ez2view (and zooming into just QLD), we can wind a window back to 07:30 on Thursday 30th September to watch what unfolded…
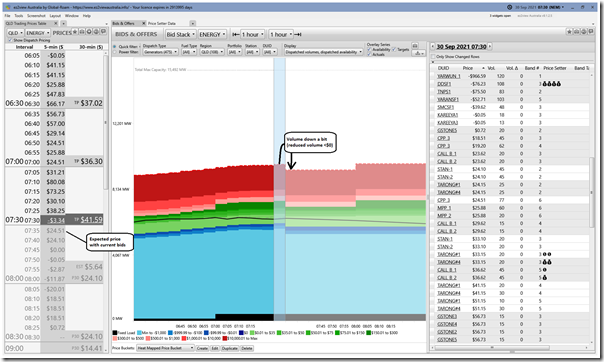
07:30 Thu 30th Sept – QLD Price Expectation Low
Starting at the 07:30 dispatch interval (i.e. last in the 07:30 trading period) we see the price expectation for the 07:35 dispatch interval was that the price would revert back from the price drop at 07:30 …
We can also see a small reduction in total volume offered (at a time when Underlying Demand is ramping up) for 07:35 compared with 07:30.
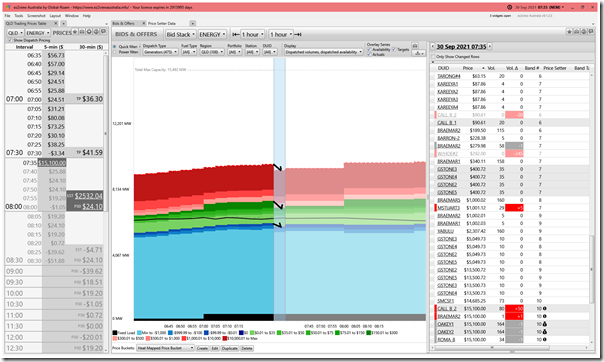
07:35 Thu 30th Sept – Price spikes to $15,100/MWh
At 07:35 we see the price spike unexpectedly to $15,100/MWh (the current Market Price Cap) … and we can clearly see a sizeable amount of volume removed from the bid bands down well below $0/MWh:
However, in addition to this we see more volume removed from the green bid ranges (including the 245MW reduction from Wivenhoe unit 2 captured in this image). Some of this volume (like 285MW at Wivenhoe 2 in total) was removed completely from the market … whilst some volume was shifted up to the Market Price Cap (Callide B2).
Note that there were many more movements … but even these two quoted were from two different portfolios.
The movement of volume, and also other limits on plant (e.g. ramp rates, FCAS co-optimisation, etc) caused the price to spike to the roof.
Note that there is nothing changed in the 5MS environment that might preclude this type of behaviour in future… what changes is what happens next….
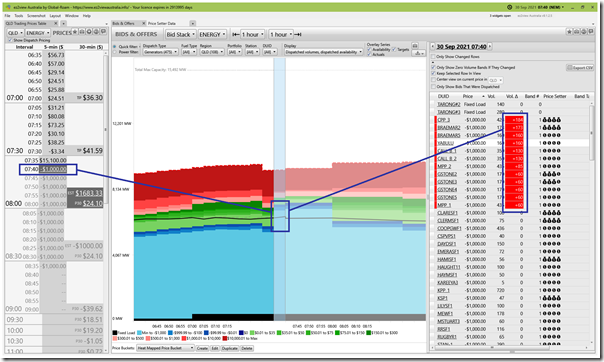
07:40 Thu 30th Sept – Price drops to –$1,000/MWh
At 07:40 we see a large amount of capacity … over multiple units (and multiple portfolios) jammed in at the bottom of the bid stack (i.e. down at –$1,000/MWh) … which causes the 07:40 dispatch price to fall down to –$1,000/MWh:
At this point, as well, the expectation was that the volume added down at –$1,000 would remain there for the next 4 x dispatch intervals:
1) Why not, you may ask, given what the expectation was for the half-hour trading price
2) However this is also where the constraints of 30-minute bidding also play a large role.
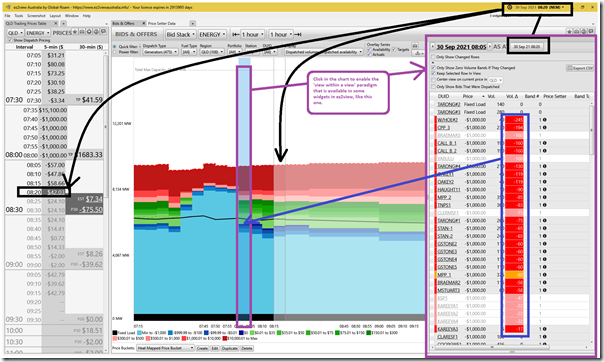
08:20 Thu 30th Sept – Looking back at the 08:00 (30-minute) Trading period
Winding well into the next trading period (i.e. 08:20) and looking backwards we show the final snapshot for this article:
Utilising the more powerful ‘view within a view’ paradigm by clicking in the bid chart, we can also see the large volume of capacity shifted away from –$1,000/MWh when its usefulness there had ended at the close of the 08:00 trading period … leading the 08:05 dispatch price to revert to more ‘normal’ negative levels.
We see that this ‘more normal’ behaviour persisted through till 08:20 (the Time-Travel point) at least.
—
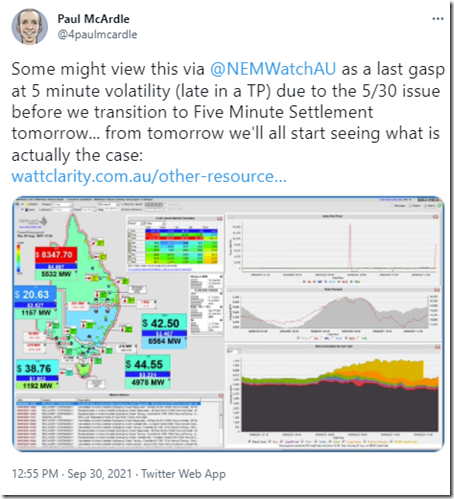
… and that is where we leave today’s article … remembering that there were were a couple other spikes in the QLD region later on Thursday 30th September, like this one at 12:55 in this tweet on Thursday early afternoon:
Note that this was second last dispatch interval in that 13:00 trading period!


Be the first to comment on "A first view of bids under Five Minute Settlement"