Worth a short note today to highlight that daytime minimum demand in South Australia has dropped lower still in South Australia, supercharged by mild springtime temperatures (only 18°C in Adelaide currently) and cranked up injections from ‘Small Solar’ (i.e. rooftop PV).
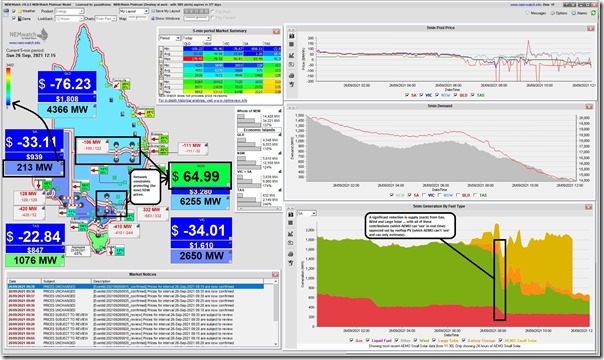
Here’s a snapshot at 12:20 early this afternoon from NEMwatch v10.2 showing the ‘TOTAL DEMAND’ figure (a representation of ‘Scheduled Demand’, or ‘Market Demand’) down at 213MW:
(You’ll note we have switched the installed copy of NEMwatch to displaying AEMO’s estimates for rooftop PV compared with the APVI estimates shown up until and including NEMwatch v10.1 – we have done this for several reasons, including the make the data sets from a uniform provider. There is interpolation utilised between the 30-minute estimates for rooftop PV from the AEMO).
The 213MW point above is well down towards the bottom of the relative scale (hence the deep blue region colour) – indeed this mark is (at the time I started writing) the lowest-in-NEM-times point for this measure, with the exception of the period surrounding the SA System Black in September 2016. Victoria is quite low as well, we see.
I’ve also noted on the NEMwatch snapshot how:
1) A significant drop in production across the three ‘wholesale’ fuel types supplying in the South Australian region – we can clearly see a drop from Gas-fired power, and a larger drop from Wind generation, but there is also a drop in Large Solar as well (all squeezed out of the market by invisible rooftop PV).
2) Transmission constraints QLD-NSW and VIC-NSW are protecting spot prices in NSW currently … with the other regions being consistently below $0/MWh through the day (a trend that is increasing … such a shame that the we collectively did not make the effort to make Demand Response work with negative prices – with the much touted ‘Demand Response Mechanism’ only a month away from commencement).
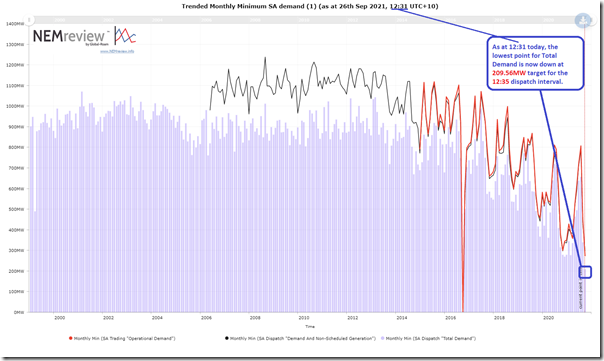
By the time I’d opened up the following pre-prepared query from NEMreview v7, it had dropped further still (to a low of 210MW for the 12:35 dispatch interval):
Those with a licence to NEMreview can open their own copy of this query here.
… but no sooner had I added this in than I see the low point edge lower (down to 187MW for the 12:50 dispatch interval) and then lower still (to 184MW for the 13:20 dispatch interval)!
1) Those who want to understand more of the gory details of how demand is ‘measured’ the linked article can help … not as easy as it might otherwise seem!).
2) Quite likely that AEMO will be along in the next couple days to report the official figures using after-the-fact verified ‘Operational Demand’ methodology.
What’s happening today is merely an illustration of how quickly these ‘low point’ records are continuing to tumble, with no end in sight…
Plenty of challenges steaming down the road for balancing supply and demand, and keeping the lights on in the NEM (with the Invisible Man just one of the challenges)!
—————
PS added Tuesday 28th Sept 2021
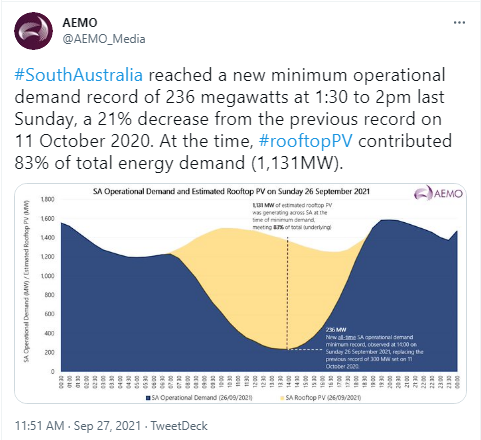
As expected, the following day (Monday 27th Sept) the AEMO confirmed the new Minimum Operational Demand point down at 236MW for the half-hour ending 14:00 NEM time:
The image above was a tweet here from the AEMO account … but the growing conversation here on LinkedIn might be of particular interest.


On the flip-side of this article, what is the forecast peak load for SA this coming summer? Noting peak during a heat wave will happen at about 7pm when solar is gone and it is potentially still and calm weather across SA. Without NPS, Playford and now all of TIPSA (so minus some 1260 MW), does SA have enough conventional generation plus interconnection capacity (assuming there are no problems elsewhere like in Western Vic and something can come through from Murraylink)? Has any shortfall been flagged by AEMO?
And directly related to this article, what happens when SA eventually occasionally/more regularly drops into negative demand territory due to the amount of non-scheduled embedded solar PV and then SA islands? How is SA run by AEMO as a stable island?