
Celebrating my twentieth year in the industry, 2021 has thrown a lot of interesting curve balls and market dynamics to investigate.
Today, we are going to look at the incredibly interconnected supply and demand conditions of Australia’s east coast energy markets and beyond.
We will look at the four contagion of scarcity events since mid-May 2021.
Contagion 1: The lasting impact of Callide C
Failure at Callide C
Let’s start with the failure of the Callide C Unit 4, jointly owned by CS Energy and Intergen. Commissioned in 2001 at 2x420MW units, Callide C is the fourth youngest coal power station in the NEM after Kogan Creek (2007), Tarong North (2003) and Millmerran (2002).
On the 25th May 2021, Callide C Unit 4 suffered catastrophic failure with the following details extracted from the AEMO preliminary report and NEM market data:
- 13:34 Callide C4 appeared to trip offline without success after derating over the hours prior.
- 13:44 Callide C3 successfully tripped offline. C4 remained online.
- 14:06 Set of events, although causality will be updated by the report from Dr Sean Brady, but the following order seems logical.
- ~1st: Callide B2 tripped offline. It appears that C4 remained online. AEMO Preliminary report (Figure 3) has a jump in the QNI flows at 14:06:20 aligning with a frequency drop (Figure 2), which is about 20 seconds before the jump that resulted in QNI tripping. This is about the size of Callide B and it would make sense that it was tripped before Calvale substation.
- ~2nd: Next in line would be the Calvale switchyard which was tripped remotely at the far end of the transmission lines. This finally fully disconnects C4 from any power source. The geographical implications are illustrated in
- ~3rd: Stanwell 1, 3 & 4, Gladstone 2, 3 & 4, Yarwun, Yabulu. QNI also tripped (Figure 3) and the North Queensland solar farms are constrained offline via dispatch constraints.
AEMO states that Callide C 4 was drawing up to 50MW / 300MVAr into the turbine. In or around 14:06, the Callide C turbine exploded with 150kg shrapnel found embedded in the roof (40m above).
Queensland electricity prices lifted to the market cap for the evening of the 25th May 2021 due to insufficient energy capacity as assets were slowly returning from the initial event. The average spot price for the 25th May 2021 resolved at $1,642/MWh including three full trading intervals of $15,000/MWh.
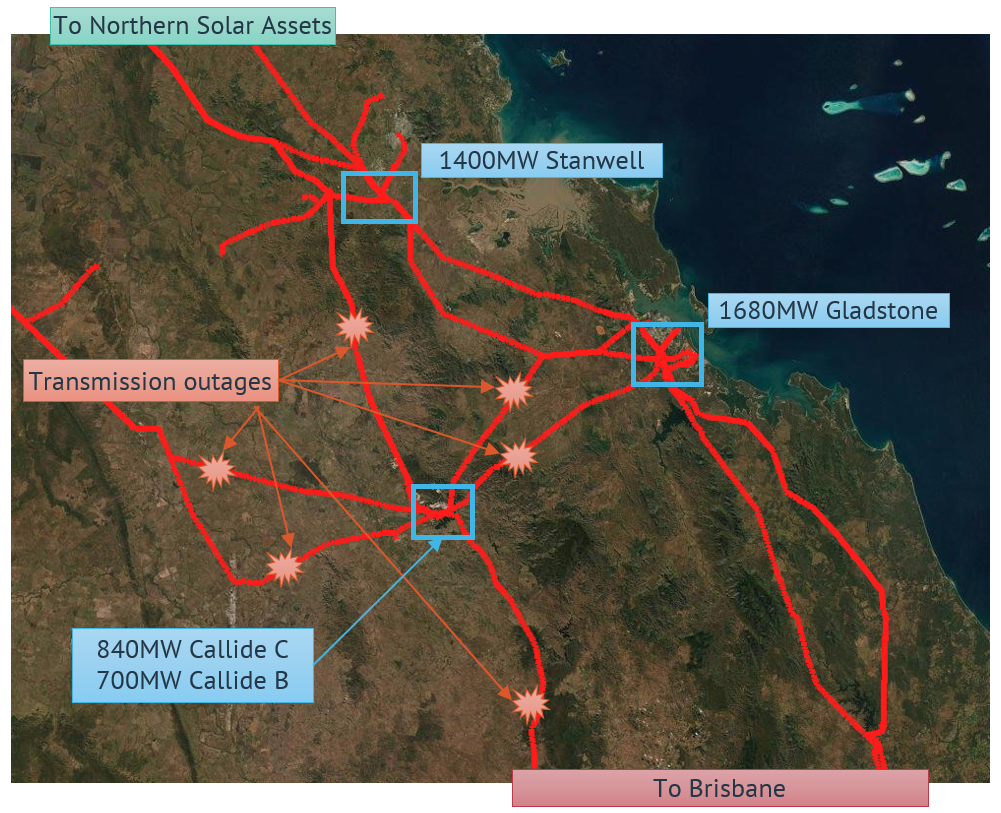
Figure 1 – Regional View of the Callide C event
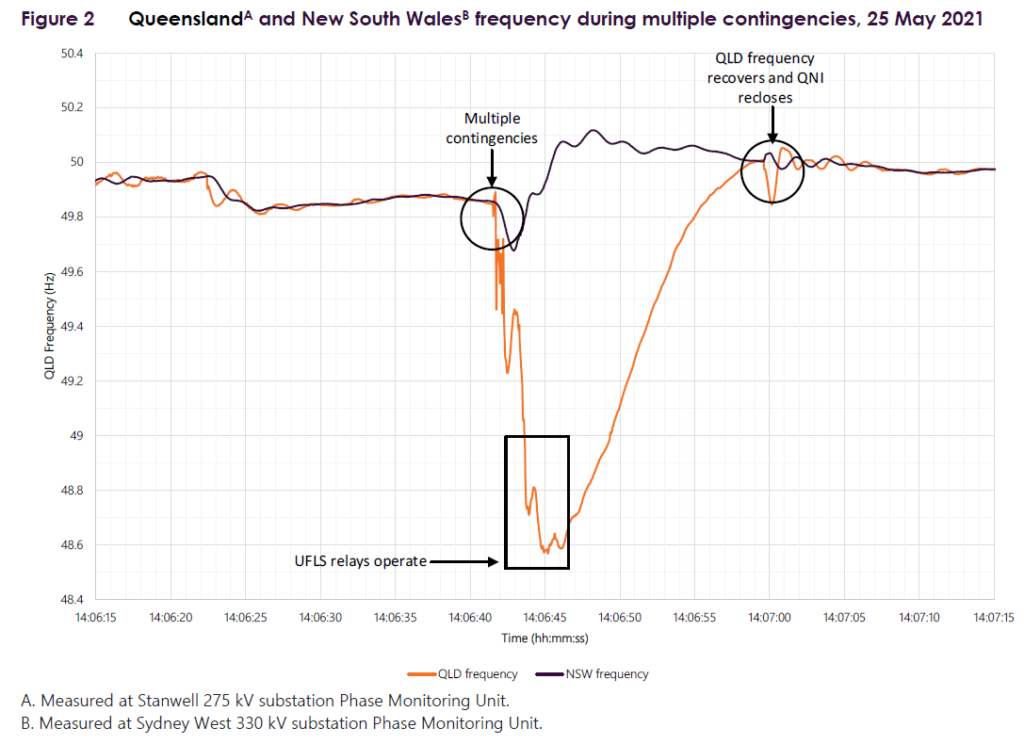
Figure 2 – Queensland and New South Wales Frequency Disconnection
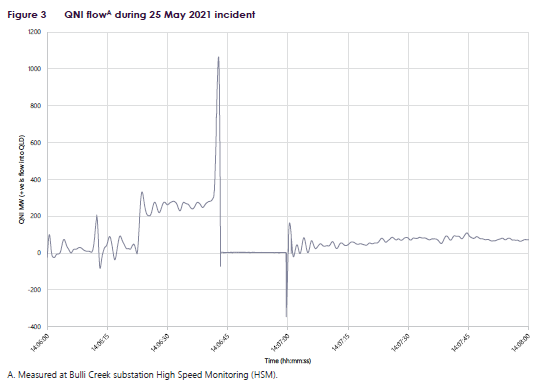
Figure 3 – AEMO Preliminary Report on the Callide C event
Supply driven higher electricity prices
While many of the Queensland assets impacted by the transmission network were back online by the 26th May, the Callide site (Callide B and Callide C) remained unavailable for at least three weeks.
As expected, the continued withdrawal of high-capacity factor supply resulted in a sharp uplift in the electricity prices beyond just the first day.
Focusing on the Queensland region, the Quarter 2 2021 resolved at $127.82/MWh with a fair value payout for a $300/MWh Cap product of $61.33/MWh. This set a new record for Quarter 2 outcomes in Queensland (pipping 2006), although short of the infamous outcomes of the Quarter 1 2017 ($173.18).
Figure 3 shows the average spot price split into fair-value cap payouts to indicate the value associated with different spot price ranges.
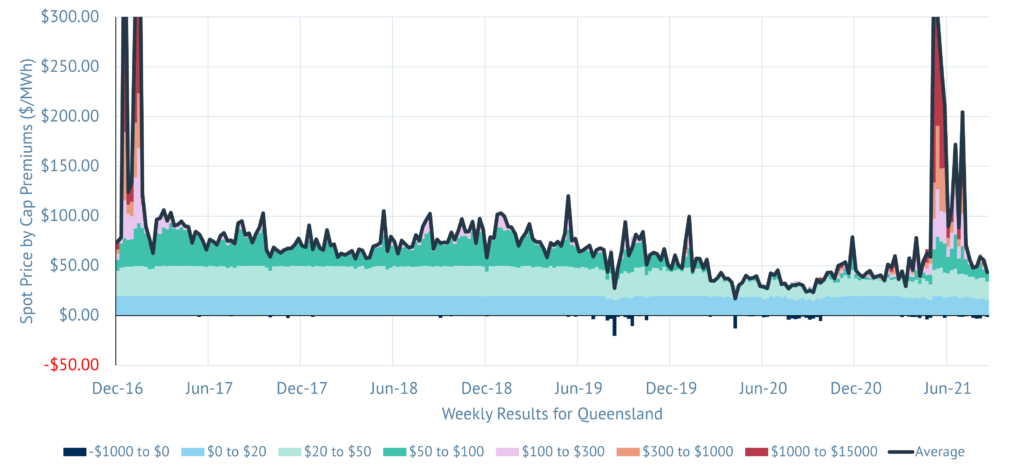
Figure 4 – Weekly Price Distribution for Queensland – Pay Payout Slivers (October 2018 to September 2021)
Time of Day Assessment
The extraction of supply from Callide B and C lifted the prices, but not in an evenly distributed way. The evening peak (highlighted red) over May to July saw much of the volatility described above.
Figure 4 shows the time of day (columns are midnight to midnight) average prices with each of the blocks corresponding month. The 18:00PE half hour for June averaged $943/MWh, whereas the 12:00PE for August averaged –$4.26/MWh.
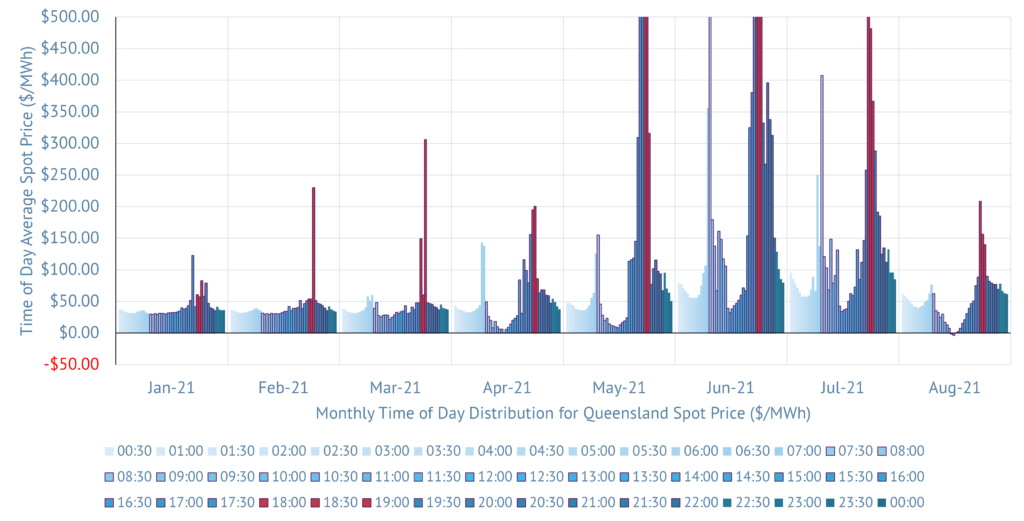
Figure 5 – Time of Day Average Prices for each Month of 2021 – 18:00PE to 19:00PE Evening Peak Highlighted
The implications of the concentration of pricing into the evening peak also resulted in a corresponding behavioural response from the gas generators (Figure 5). This uplift in gas generation meant that there was a substantial uplift in local gas consumption within Queensland.
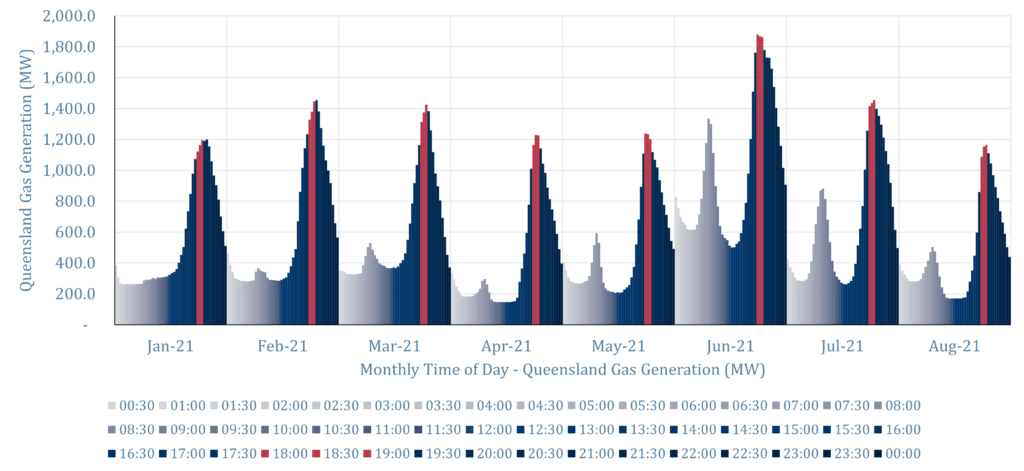
Figure 6 – Time of Day Gas Generation (MW) for each Month of 2021 – 18:00PE to 19:00PE Evening Peak Highlighted
Contagion 2: Gas destined for Melbourne
The second contagion can be viewed by shifting our analysis into the gas markets, Figure 6 illustrates the physical gas flows across the Queensland border (via the QSN) have been shown since the start of LNG in 2015. Two LNG trains (APLNG#1, GLNG#1) were commissioned at beginning of 2016 and the flows have trended toward increased southerly flow in each year until 2020.
The very mild weather conditions of 2020/21 summer lowered the domestic gas deliveries and then the 2021 winter gas flows were interrupted by Queensland gas generation – driven by the Callide C outage.
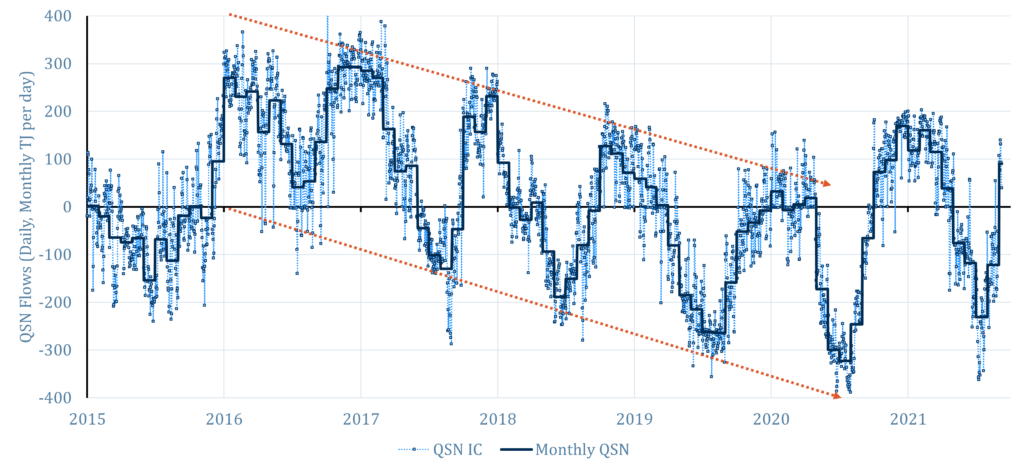
Figure 7 – Gas flows out of Queensland toward Melbourne during winter have grown. 2021 bucked the trend.
Rearranging the visualisation of the QSN flow data into a year-on-year analysis via Figure 7 highlights the carve out in domestic gas flows through until mid-July 2021 (red line) compared with 2020’s behaviour (green line) – especially prior to the July uplift in flows.
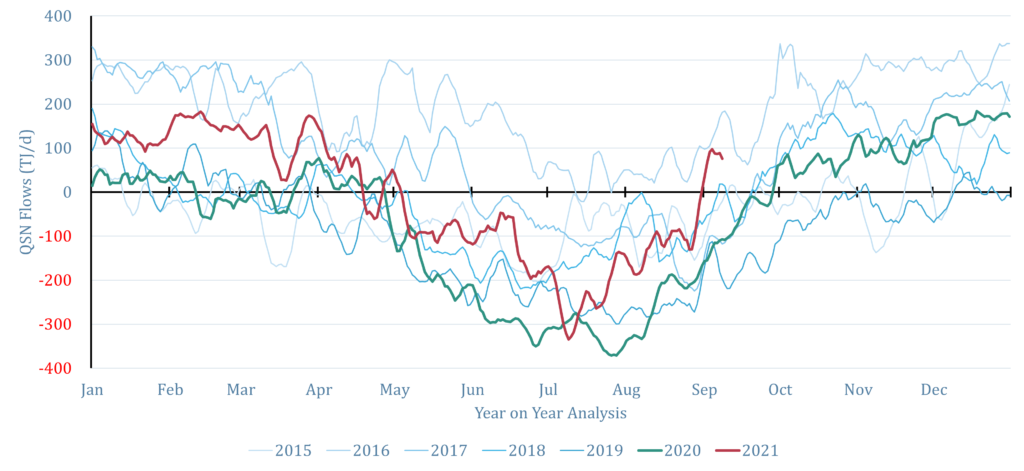
Figure 8 – Gas Flows between Ballera and Moomba (Qld border) – Year on Year Analysis
Contagion 3: Latrobe Valley Flooding
The third contagion was the unrelated flooding in the Latrobe Valley. While the root cause was unrelated to the Callide C event, the implication was that more coal generation was extracted from the market.
The flooding impacted the Yallourn coal mine and reduced the capacity of the site to just half of a single unit for nearly two weeks from the 12th June. Figure 8 shows the layered dispatch of the Callide site (first four) and the four units of Yallourn.
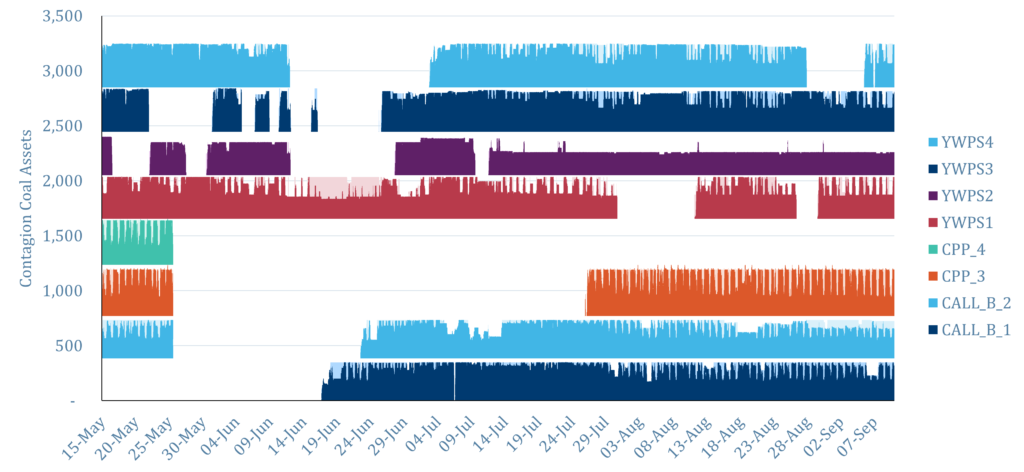
Figure 9 – Dispatch vs Capacity for Callide and Yallourn Sites (15 May to 27 July)
Yallourn was not the only energy production site impacted by flooding, the Longford gas plant also had some disruption on the 10th June, but was impacted more substantially for three weeks during July with dehydrator issues at site (illustrated in the hourly gas data in Figure 9).
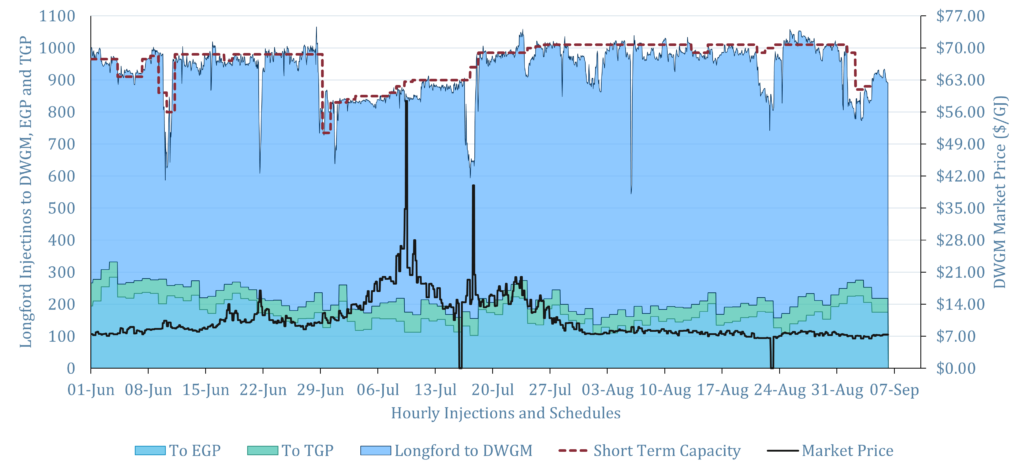
Figure 10 – Longford Gas Production and Hourly Injections (1 Jun to 6 Sep 2021)
Iona called upon
Iona completed their pre-winter outage in early May 2021 at record levels for that time of year, even higher than the 2015 levels after the “LNG ramp gas” era of late 2014.
However, the combination of the re-allocation of Queensland gas into local generation (Figure 5) which resulted in lower gas flows into the southern regions (Figure 7) and the supply constraints from the dominant gas producer, Longford (Figure 9) meant that Iona was utilised at record extraction rates during winter 2021 (illustrated with the red line in Figure 10).
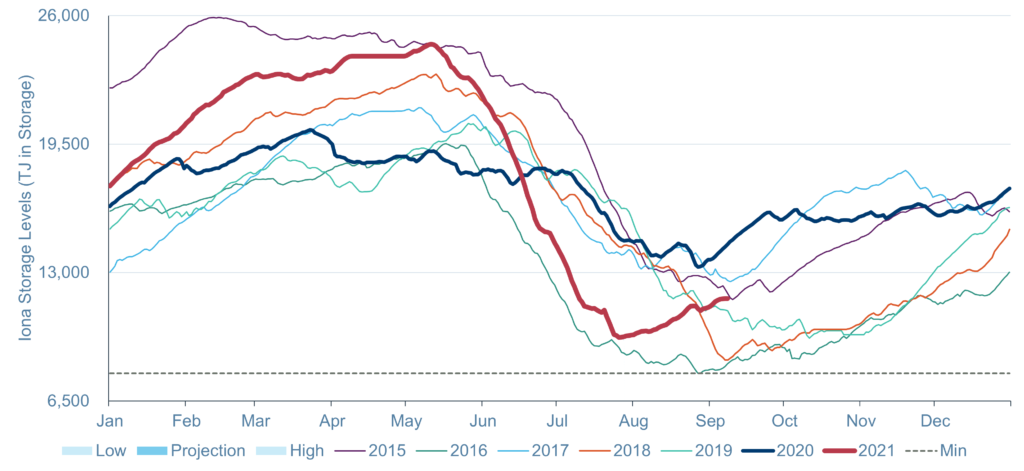
Figure 11 – Iona Gas Storage Facility – Gas in Storage – Year on Year Analysis (2015 to 2021)
Domestic Gas Prices
With the gas in storage at Iona falling rapidly toward physical minimum levels, the domestic gas market prices also spiked to a daily peak of A$34.84/GJ (for Victoria) and a fortnight average between $16 and $20/GJ for the major domestic gas markets (fortnightly gas prices against the ACCC-reported JKM Netback for the Prompt 12 Months shown in Figure 12).
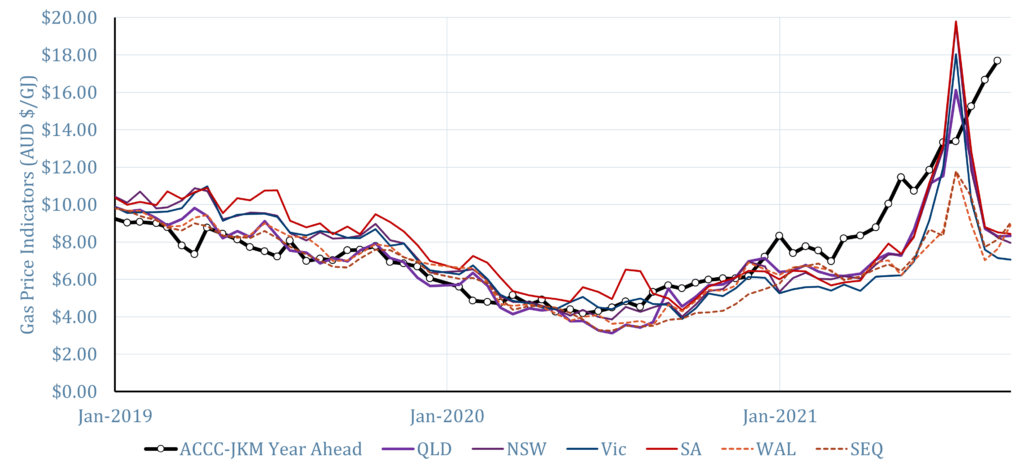
Figure 12 – Domestic Gas Prices vs International Gas Prices
The weather that changed everything
The sharpness of the winter market conditions changed at the end of July. The weather warmed across the South-East Australia (Figure 13), reducing the demand for gas and the requirement of Iona to provide peak supplies. Longford returned to full capacity with limited downtime.
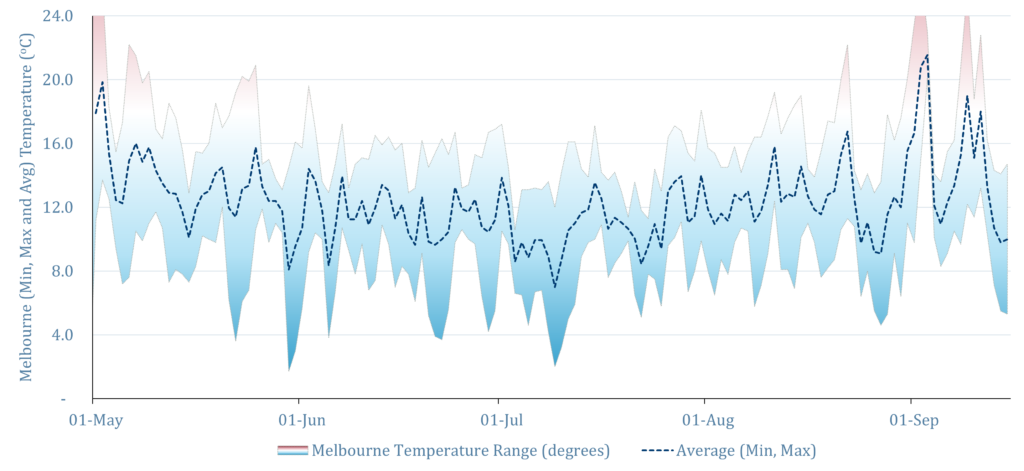
Figure 13 – Melbourne Weather Conditions
Further, on the electricity market front, the Callide and Yallourn sites returned from their outage and the wind generation across South Australia and Victoria lifted to record market share, as well as record renewables.
Exiting Winter
As we move out of winter and into spring, the collimation of the electricity market’s supply side relief and the tempering of demand has predictably put downward pressure on the live spot market outcomes for the electricity market. South Australia has seen daily averages below $0/MWh for eight of the past twelve days.
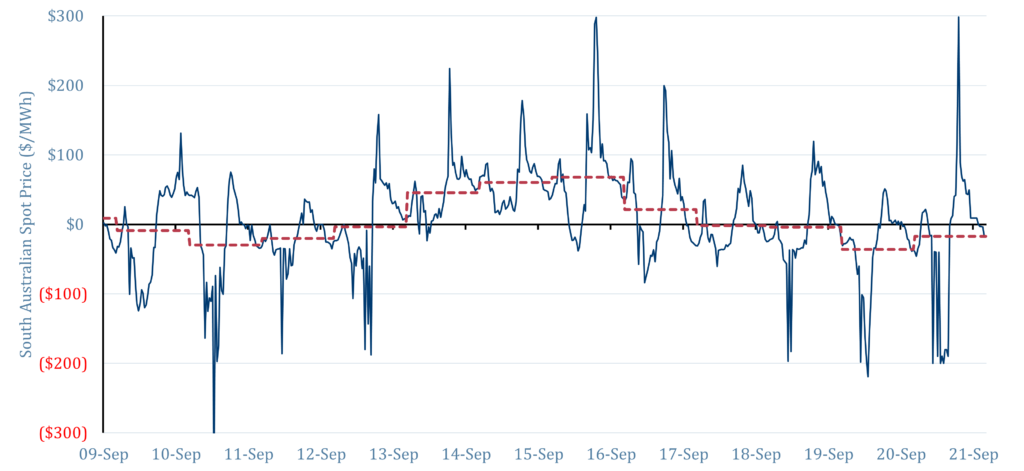
Figure 14 – South Australia – Eight Negative Days from Twelve
Contagion 4: International pressures
In the domestic gas market, the concerns remain with the rising international gas market prices. These are being driven by a world of complications, including droughts in Brazil causing a switch to gas, Hurricane Ide over Louisiana disrupting gas supplies and exports from the US, Russia’s Nordstream 2 having delays on start-up, increased gas consumption from a hot Northern summer, falling European gas storage position and still wind conditions creating their own scarcity conditions across the entire planet.
None of these issues are Australia centric, but the influences of the international market will be difficult to ignore, especially with the ACCC reported JKM netback prices currently just shy of A$30/GJ for February 2022 deliveries.
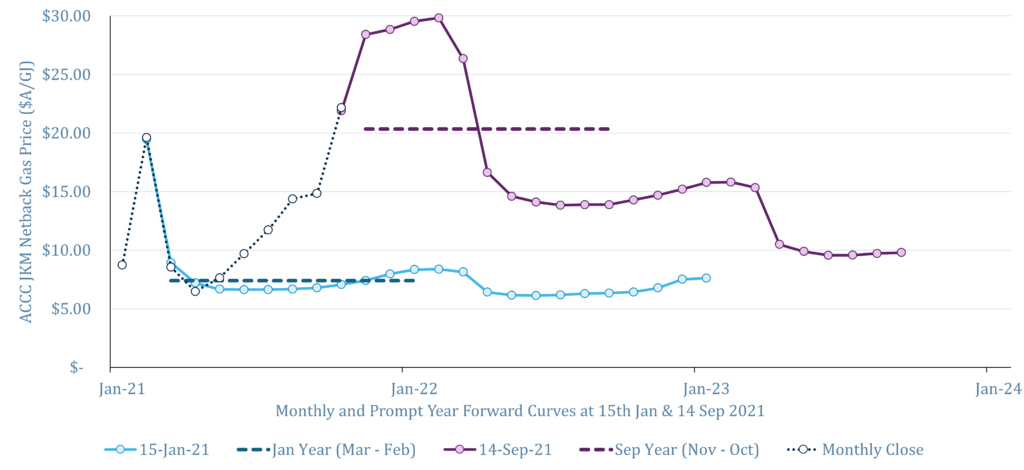
Figure 15 – ACCC reported JKM Netback Forward Curves – 15 Jan and 14 Sep
======================================================================================================
About our Guest Author
 |
Joshua Stabler is the Managing Director at Energy Edge.
He has extensive experience in supply-side market operations for the electricity and gas sectors, and as an advisor and system developer in the Australian energy industry. You can view Josh’s LinkedIn profile here. |
Be the first to comment on "The Contagion of Scarcity"