Well, that ‘all time’ record in instantaneous wind production last Tuesday 20th July 2021 sure didn’t last long!
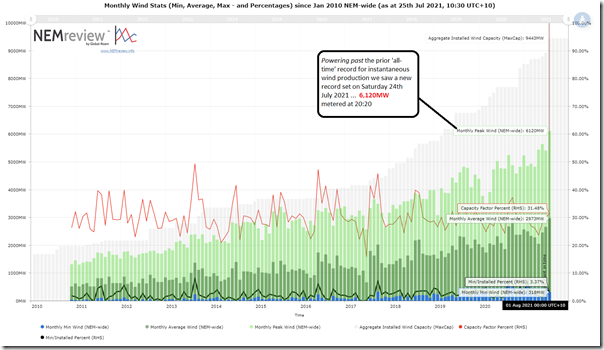
Here’s an updated view of that NEMreview trend in month production stats prepared on Sunday morning, 25th July 2021:
In that article we noted that Tuesday’s instantaneous wind production peaked at 5,899MW … and that the level was (albeit very briefly) a new ‘all time’ record.
As noted in the snapshot above, yesterday’s gusty weather did not just nudge the record up a bit … it blew it 221MW higher (to 6,120MW metered at 20:20 as ‘Initial MW’ for the 20:25 dispatch interval on Saturday 24th July 2021). That’s quite a boost!
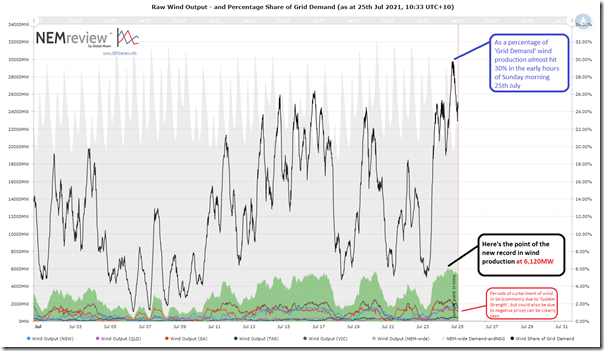
Here’s the more granular trend of wind production data through July 2021, updated with a few more days now:
For those clients with their own licence, they can access their own copy of this query here.
As noted on the chart, in the early hours of this morning, wind almost reached 30% share of instantaneous ‘Grid Demand’ on a NEM-wide basis.
With the Olympics fully underway, now, then that point in time meant:
1) The VIC region was clearly Gold Medal (at 2,305MW)
2) The SA region surged to 1,744MW for Silver
3) The NSW region was a comfortable Bronze at 1,581MW; whilst
4) TAS (353MW) and QLD (137MW) brought up the rear.
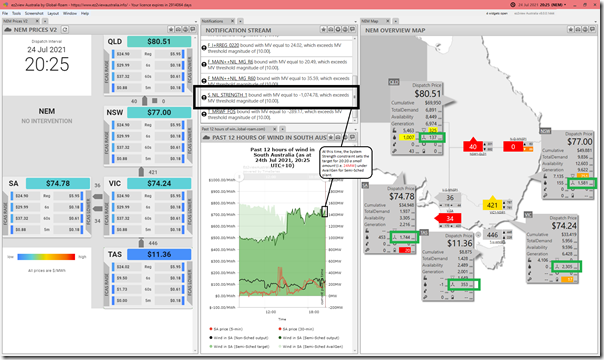
What makes SA’s production more remarkable was that it was able to reach this level despite the ‘System Strength’ constraint still being bound at the time… (i.e. so Wind in SA could have supplied a little more, but was unable to). We can see this in the following snapshot from ez2view time-travelled back to 20:25 yesterday:
Keeping in mind that we’re looking at InitialMW for 20:25 (i.e. ‘Final MW’ for 20:20) we compare Available Generation (i.e. modified by AWEFS or the Self-Forecast) with aggregate Target and we see that this is 24MW lower … i.e. this is the (small) amount that is curtailed due to System Strength constraint in South Australia at this time.
We can see a much greater volume curtailed from 12 hours beforehand up until 15:00 that afternoon, when the Semi-Scheduled volume allowed to dispatch (via Targets) shows a step increase.


Leave a comment