When we* compiled the Generator Report Card 2018 two years ago, one of the themes we chose to highlight, and focus on, was that ‘the NEM is becoming increasingly dependent on the weather‘:
* ‘we’ being us at Global-Roam Pty Ltd Pty Ltd, working in conjunction with Jonathon Dyson’s team at Greenview Strategic Consulting – and with valued assistance by a range of others.
This was explored in Theme 6 within Part 2 of the 180-page analytical component within the ~530-page GRC2018.
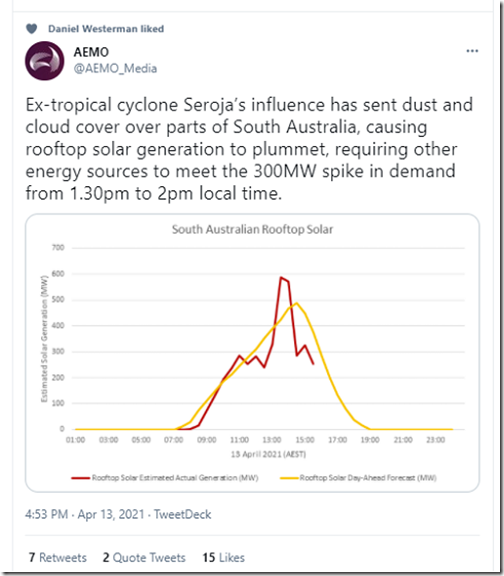
Since that time we have seen a number of examples of this evolution – with a doozy seen during the past week (on Tuesday 13th April) in this tweet from AEMO:
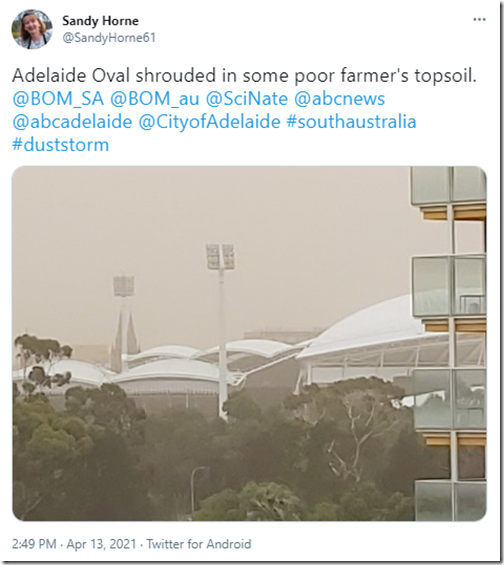
I also saw this tweet from Sandy Horne that helps to explain illustrate how those ‘butterfly wings’ could be felt so far (~3,000km?) away:
Quite remarkable – and really does bring home the point that ‘the NEM is becoming increasingly dependent on the weather’!
I’d started this article during the week, but had not completed (just due to general busyness) – but have finished it off now due to a couple of questions we have received offline.
(A) AEMO preparations
Ahead of time (at 08:25 on Tuesday 13th April) the AEMO did issue Market Notice 84195 that warned of the possibility of ‘abnormal conditions’:
__________________________________________________
Notice ID : 84195
Notice Type ID : Subjects not covered in specific notices
Notice Type Description : MARKET
Issue Date : Tuesday, 13 April 2021 at 08:25
External Reference : Non-credible contingency event more likely to occur due to existence of abnormal conditions – SA region
__________________________________________________
AEMO ELECTRICITY MARKET NOTICE.
AEMO has identified that a non-credible contingency event is more likely to occur because of the existence of abnormal conditions namely severe weather in the SA region.
As at the time of this notice the criteria for reclassification of any non-credible contingency event have not been met, however there is a possibility of severe weather impacting multiple transmission elements in its vicinity.
Conditions can change rapidly and potentially impacted plant may change. Further notices will only be published to advise of any reclassification, or when the abnormal conditions have ceased to impact the likelihood of a non-credible event occurring.
Constraint set I-VS_250 invoked at 0830 hrs 13/04/2021 until further notice.
Manager NEM Real Time Operations
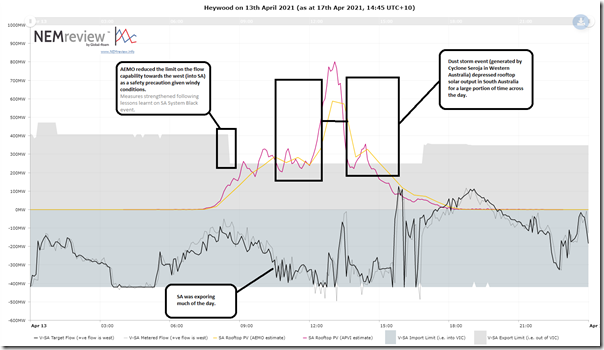
The AEMO Market Notice spoke directly about the types of risk that they were focused on with the weather system … namely “a possibility of severe weather impacting multiple transmission elements in its vicinity” – as a result of which the flow over the Heywood interconnector was reduced in order to allow for a bigger buffer (e.g. bigger adrenalin shot pumped in quickly from VIC) if something were to go awry.
It’s understandable that this was the focus, given how the AEMO was not as prepared for the weather event in the leadup to the SA System Black event (a few years ago now).
Opening up NEMreview v7 we were able to quickly prepare the following chart that illustrated the precautionary limitation that the AEMO imposed on the Heywood interconnector between VIC and SA (licensed users can access the query here):
Remembering that interconnector flow needs a number sign (i.e. a direction that is positive, and a direction that is negative) and that the NEM Rules are written to have the effect that flows away from Hobart are positive, that means VIC to SA is the positive direction of the Heywood interconnector.
On Tuesday 13th April, we see that the flow was primarily to the east (i.e. with SA exporting into VIC) – but we see that the interconnector did play an important role as a ‘shock absorber’ as the rooftop PV gyrated significantly in a short space of time between 13:00-13:30 (NEM time) on the day.
(C) Market Impacts
A couple quick notes about market impacts:
(C1) Solar Production Suffered
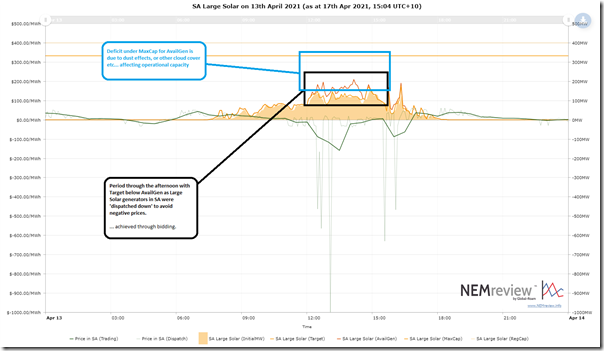
In the trend above, we can see that the rooftop PV was depressed through much of the day – at least in part because of the cyclone-driven dust effects. For completeness I also took a quick look at the aggregate effect of the same on the 3 x Large Solar units operational in South Australia (Tailem Bend, Bungala 1 and Bungala 2 – in this query):
We also see here that the (energy constrained) Available Generation capacity for the plant was well below the Maximum Capacity of the plant, as registered with AEMO. It was also quite a ‘bumpy’ profile through the day.
———
In summer 2019-20 we experienced the effects of bushfire smoke on solar production capability.
1) Well, during the past week we saw a different permutation (i.e. dust storm) of the same type of effect.
2) The NEM really is becoming more interconnected with the weather – which will bring its own set of challenges, moving forwards.
Note that these solar farms also under-performed, relative to their (energy-constrained) Available Generation capacity.
1) This effect was due mostly to the generators avoiding unprofitable operations during periods when the SA price was quite negative (the ‘system strength’ constraint was also bound for a lot of the day).
2) A useful time to remind readers that (following this AEMC Rule Change stemming from the AER Issues Paper) that Semi-Scheduled generators can only deviate from their target due to weather effects.
(C2) ‘Grid Demand’ gyrated significantly
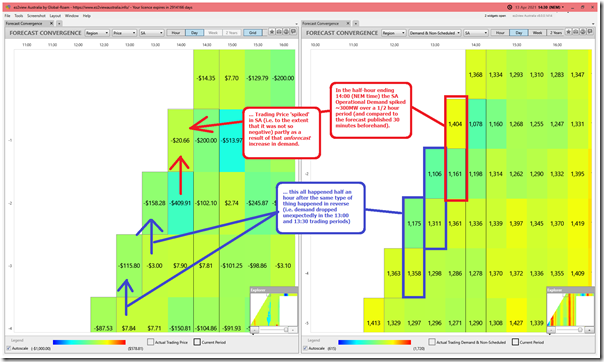
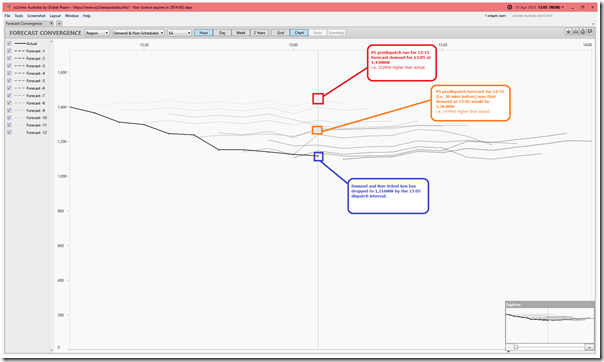
The ‘Forecast Convergence’ widget in ez2view makes it easy to see how AEMO’s successive P30 predispatch forecasts varied through the period of the impact – here’s two widgets together, Time-Travelled to 14:30 (NEM time) on Tuesday 13th April 2021:
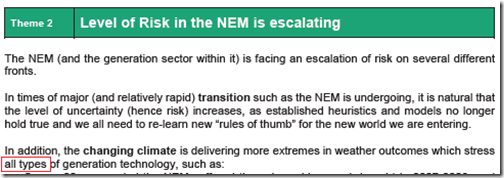
Also in the GRC2018 we included discussion about how ‘the level of risk in the NEM is increasing’:
… with one of the illustrations of this being the reduced volume of energy offered in the ‘green’ bid price ranges over time (i.e. between $0/MWh and $300/MWh). Especially in a region the size of South Australia a rapid (and unexpected) change in grid demand of ~200MW in size should be expected to move the price significantly – as we see above.
Even though the price changed from negative to less negative (or negative to more negative) we should not forget the fact that these changes in pricing by more than $100/MWh also significantly change returns for all types of generators running at the time.
(C3) Wind Production was high for the whole day.
The prices did not spike above $300/MWh, though – with one of the main reasons for this being that the wind production was blowing strongly, not just in South Australia but right across the NEM (with a new all-time record set that evening as discussed here).
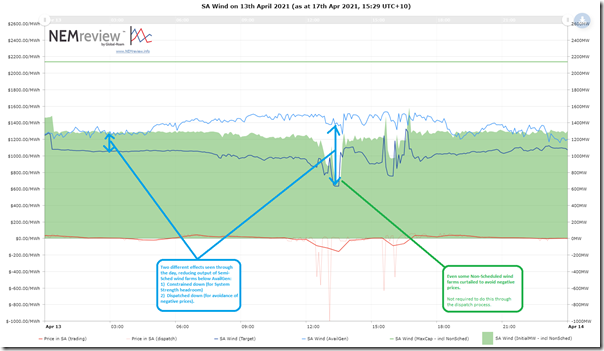
The aggregate production of the wind farms in South Australia through the day can be seen here (the query from NEMreview is here):
A couple quick points here:
1) We see that the aggregate production from all wind farms in South Australia was very consistent through the day (~1,300MW).
2) This occurred because for much of the day the ‘S_NIL_STRENGTH_1’ constraint equation was capping the output of the Semi-Scheduled Wind (and Solar) Farms across South Australia (to approx 1,050MW – with the remaining amount coming from the Non-Scheduled wind farms).
3) Through the middle of the day, when the price dropped quite low, we see a larger volume of wind energy ‘spilled’ as a result of generators avoiding dispatch at negative prices:
(a) Non-Scheduled wind farms are able to do this outside of the NEMDE dispatch process;
(b) Whereby Semi-Scheduled wind farms are required to do this through bidding behaviour, as noted above.
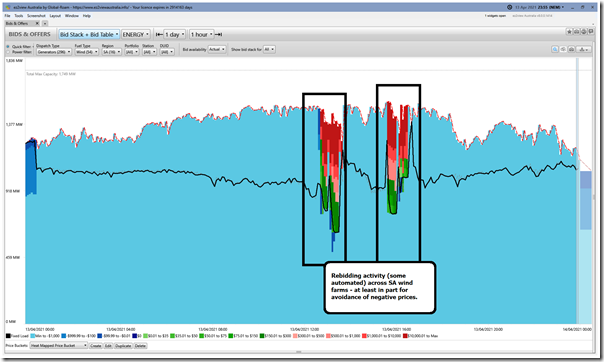
4) This led to plenty of rebidding activity through the day, as we can see in this snapshot from 23:55 looking backwards in the ‘Bids & Offers’ widget in ez2view :
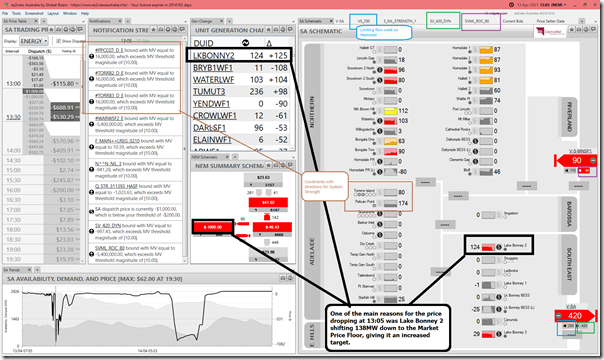
For instance, here’s a snapshot of the 13:05 dispatch interval in ez2view, with the dispatch price in SA dropping to –$1,000/MWh as a result of Lake Bonney 2 shifting 138MW down to the Market Price Floor:
The other ‘$’ symbols on the SA schematic also represent bids changing for the 13:05 dispatch interval … some of them produced by an auto-bidding algorithm:
There has been a marked increase of units using them in the NEM and, as part of the broader ‘GenInsights21’ project, we will look to see what we can do to systematically review their operations.
This happened:
1) Because the prior rebid submitted at 12:40 only shifted volume for the 13:00 trading period (i.e. meaning that volume returned to the prior –$1,000/MWh price band for the 13:30 trading period – i.e. beginning 13:05); and
2) It also happened alongside with an unforecast ~220MW evaporation of forecast ‘Demand and Non-Scheduled Generation’ in the South Australian region over the half-hour to 13:05, as seen in this alternate ‘Forecast Convergence’ view in ez2view:
In hindsight, perhaps there would have been a better approach there in the rebidding?
(D) Continuing the analysis, in ‘GenInsights21’ … you can pre-order your copy now!
In the article above I have quoted from two of the fourteen Themes included in Part 2 of the 180-page analytical component of the 530-page GRC2018.
1) Since the release of the GRC2018 we have updated and extended the statistical component in the GSD2019 and then the GSD2020 (also with a Data Extract).
2) We are now in the process of updating the analytical component with the intention of releasing during Q3 2021 as ‘Generator Insights 2021’. For GenInsights21 we are already on the way to extending the work we did in the GRC2018 to explore/analyse various challenges with the energy transition, and will look forward to having those pieces of analysis released.
We’d invite those who want to pre-order now.
We won’t process your payment until you’ve been provided with access to the PDF copy of GenInsights21 (and a hard-copy has been delivered to you). We currently expect to do this in Q3 2021.
————————-
PS … about AEMO Communications
In discussions with a number of our clients and colleagues about this particular event (and following on from prior conversations about other aspects of communications channels) we wonder how AEMO communications are going to evolve in future – given that there have been a number of channels they use, the focus of which is a little overlapping:
Channel #1) Market Notices are (understandably) dry communications, intended for AEMO’s direct stakeholders (i.e. participants in the market).
(a) It is AEMO’s most important communication channel.
(b) It was, understandably/necessarily, where the AEMO communicated about the precautionary step taken to reduce the flow capacity west on Heywood in advance of a possible unit trip (that, and through the more detailed constraint equations that are visible in software like ez2view).
Channel #2) Yet it was on the AEMO twitter channel, and not through a Market Notice, that the AEMO communicated about the difficulties in forecasting Grid Demand.
(a) This was a point made by several people in conversations after that point.
(b) My experience has been that the AEMO twitter channel has proven quite useful – with the above being a good case in point.
Channel #3) The broader AEMO website can be a very repository of all sorts of information – but the number of people (inside the AEMO and outside – including myself) who I have heard say ‘I need Google to find anything’ suggests it could be so much more.
One suggestion i would have personally is that any document (PDF, XLSX, etc) that goes on the AEMO website should be given a permanent home at something like documents.aemo.com.au/Unique-Document-GUID.pdf (for example – not www.aemo.com.au) and never move, even if the version of the document becomes superseded by a more recent version (which would have its own GUID-based address). In that way the direct address of any document might remain the same through any future reorganisation of the AEMO website (at www.aemo.com.au) itself.
Channel #4) The ‘AEMO Live’ service seems (to me) to be a channel that has not really found its purpose. Maybe I am missing something?
With the new CEO starting on 17th May (a month away) we will be interested to see how these approaches evolve.


Leave a comment