Frequent readers will understand that I’ve been investing a fair bit of time looking back into prior years for the purposes of preparing a growing number of Case Studies of these 98 extreme events relating to Aggregate Raw Off-Target for all Semi-Scheduled plant. We’ve been doing this because of broader questions prompted by the AER Issues Paper* but moreso inspired by the deliberations by the (now defunct) COAG Energy Council and (under threat?) ESB relating to ‘NEM 2.0’.
* on that note, readers might be aware that the AER issued a brief (5-page) ‘Proposal Update’ late today.
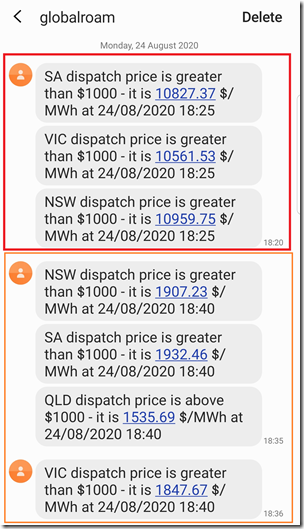
However my attention was reverted to the present by the buzzing of a series of ‘High Price’ alerts this evening, as seen here:
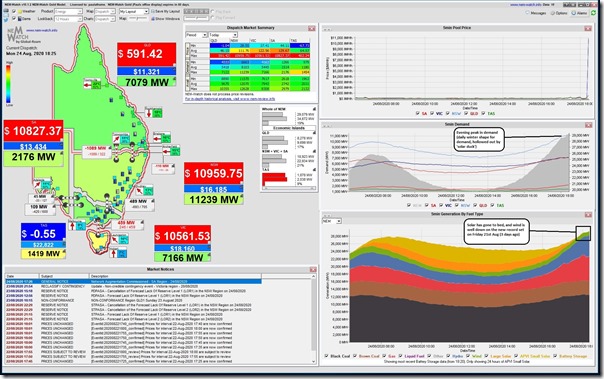
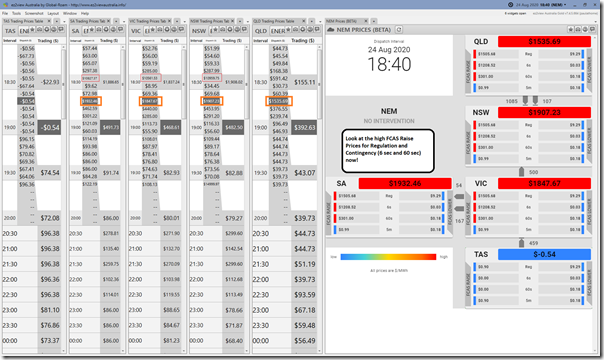
Prices spiked above $10,000/MWh in the 18:25 dispatch interval in 3 regions (SA, VIC, NSW) and then above $1,000/MWh in the 18:40 dispatch interval in four regions (SA, VIC, NSW and QLD). Here’s how the first spike looked in a snapshot automatically recorded in a display copy of NEMwatch v10 (the entry-level dashboard) we have that runs continuously in our office:
Curiosity got the better of me, so I had a quick look and thought I would share some things (the annotations are discussed below)…
(A) Let’s first look at prices
Two of the points of value of our ez2view (higher-end market dashboard) tool are the ability for users to create their own dashboard, and to rewind the market to see how it appeared at some historical point via the ‘Time Travel’ functionality. Putting the two together, we’ll have a look at three specific dispatch intervals as follows:
(A1) The 18:05 dispatch interval
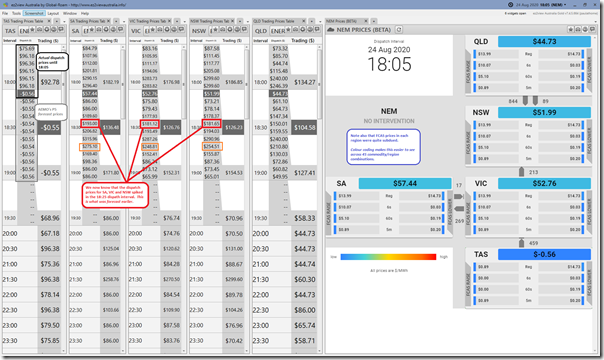
Remembering that the first spike occurred at 18:25, the first question that occurs to me is whether this price was forecast ahead of time. Whilst we could look in some detail with the ‘Forecast Convergence’ widget, I prefer to show all 5 regions together in this view – which also incorporates a view of the current FCAS prices for each region, as well.
So we’ll start with this view time-travelled to 18:05 (first Dispatch Interval in the Trading Period):
We see that the AEMO forecasts were for the prices to trend up – but certainly not up to the $10,000/MWh mark.
(A2) The 18:25 dispatch interval (1st Price Spike)
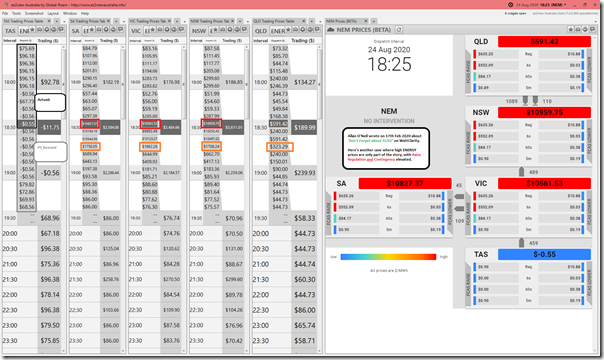
Skipping 18:10, 18:15 and 18:20 (all of which did not predict the $10,000 prices) we see the 18:25 dispatch interval outcome:
Two things to quickly note here:
1) Firstly, we see that it’s not just ENERGY prices which are up – FCAS prices are also up, as well. Allan O’Neil wrote ‘Don’t forget about FCAS!’ on 17th February as the Heywood islanding event continued… and some time before a number of market participants realised that they were being burnt by high FCAS prices.
2) We also note that, at this point, the AEMO’s P5 predispatch forecast were showing an expectation that the 18:40 price would be elevated. Job done, you might say – however note the expectation was also that 18:30 and 18:35 would be up, as well…
(A3) The 18:40 dispatch interval (2nd Price Spike)
Skipping 18:30 and 18:35 (which we see did not meet the high price expectations) we see the 18:40 dispatch interval outcome:
What’s particularly jumping out at me here are:
1) That the forecast for elevated prices in 18:30 and 18:35 did not materialise – but 18:40 did;
2) However what’s perhaps more important is the quite large prices seen for FCAS Raise Prices (both Regulation and Contingency (6 sec and 60 sec)) in all mainland regions.
The NEM is a complex place!
(A4) When was the last time when it spiked, anyway
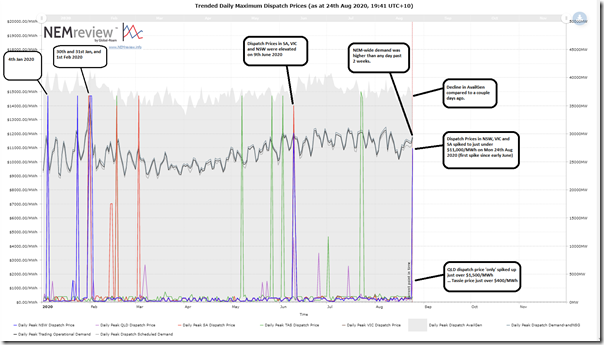
One of the reasons why my curiosity was spiked was because it had seemed to be quite some time since I’d seen prices of that calibre eventuate in the NEM (certainly not like the ‘every night’ adventures of some winters years ago). So I quickly pieced together this trend of daily extremes since the start of the year using NEMreview v7 which I then annotated as follows:
Skipping past the headline events of summer 2019-20, we see that price spikes (especially multi-region ones) were few and far between.
1) I recalled, on seeing this chart, how I’d already written about ‘Dunkelflaute’ Down Under with reference to the 9th June, and there are only single region spikes in TAS and SA apart from that one.
2) This evening we saw some similarities of what happened on 9th June 2020.
(B) A couple contributing factors
Because the NEM is a complex, interconnected machine, it is almost never that a single factor is singularly responsible for market outcomes like high prices. Keeping in mind that a much richer data set will be available tomorrow, I’ve quickly drawn out three factors that have contributed here this evening:
(A1) Demand is up
Firstly, in the NEMwatch snapshot above from 18:25 I’ve highlighted how we see a fairly typical winter shape in demand (particularly in this era where daytime demand is eaten out by that hungry solar duck). Comparing the deep blue colour of the QLD region midday on Sunday with the rich greens across all regions of the NEM in the image above, we should understand that the evening time sees demand considerably higher.
Compounding this, we also see (from the trended NEMreview chart above) that the peak in NEM-wide demand was higher this evening than it had been for the past 14 days.
1) This is primarily temperature related.
2) Demand this evening was nowhere near ‘peak all time’ territory, but it was higher than it had been in recent times – which was enough, when coupled with the following.
(A2) Less coal generation available
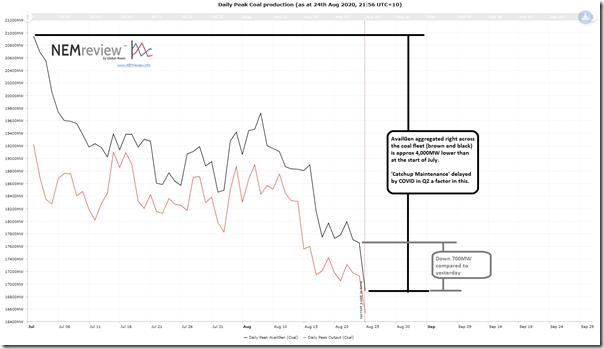
In the following trend produced in NEMreview v7 , we see that the available capacity across the coal fleet spread across QLD, NSW and VIC has declined as we’re approaching the end of Winter:
I’ve not invested time to look at the specifics of which units are out (other than to notice 3 units at Yallourn were out this evening), but would just comment generally that ‘catch-up maintenance’ delayed by COVID-19 responses in Q2 2020 would be one of the contributing factors here. More on that in another article.
We see that the capacity available from coal was down 700MW or so today compared to yesterday (a Sunday).
(A3) Less wind generation available
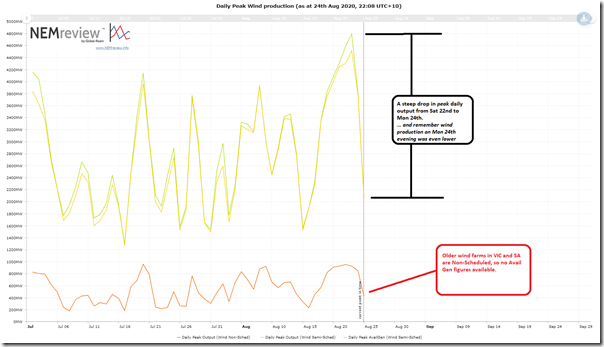
It should not surprise, given the cyclic nature of wind production that I’ve been writing about since before this ‘yin and yang of wind’ article back in February 2015, however it still does continue to surprise in some ways the rapid shifts we continue to see. Only days after we saw an all-time record production level set on Friday 21st, and then bettered up at 5,242MW on Saturday evening we see wind production sag down to approximately 1,000MW at the time of the evening peak in demand (i.e. over 2 days).
Using the same time-scale as the coal trend above, we see a different pattern for wind:
So in comparative terms, there’s about 700MW less coal generation available today than a day or so ago. This shortfall is compounded by the 4,000MW of wind generation that’s become unavailable (due to lack of wind) over the past 2 days.
Complexities indeed!


If you like to have hot coffee in the morning and a hot dinner at night you had better be thankful that there is enough conventional power available because your coffee and your dinner would be cold if we had to depend on the wind and the sun to heat them.
Four factors make it hard for RE to work in Australia. First the frequent and prolonged wind droughts (see June for example) and also WA, SA and Victoria today. Second is the “choke point factor’ that means the sustainability of RE is limited by the lowest points of supply, not the installed capacity, the high points or the average (think about our need for a constant supply of air to our lungs and what happened when we are choking or drowning). Third is the island effect, we have no neighbours to help out if we are short, unlike most places in the developed world. California has rolling blackouts but it will not go completely black because it is not an island. Finally, there is no grid scale storage in sight for the foreseeable future. Please don’t refer to the Tesla batteries as storage at grid scale. And pumped hydro? Believer it when you see it:)
I guess that no matter how much wind and solar are installed, if there is a shortage of dispatchable generation, prices will spike along with risk. That’s the point of the market – to create price signals.
I’m not convinced the price signals are adequate to see dispatchable investment. Is that a reflection on the market? Well… it’s not much of a market that matches supply with weather, instead of supply to demand, by overtly favouring semi-scheduled generators..
What’s the solution?
Not more wind and solar, that’s clear.
Batteries? Handy but expensive, a net load, and can’t do it all.
Snowy 2? For a while maybe, then another big coal plant closes and we get a drought.
Interconnection? That’s been shown on this site to be a flawed hope.
Demand management? I think so. Firstly for demand peaks, eventually for low wind and clouds.
It will probably force wealthier people to invest in home batteries and generators, in order to ride out the rolling blackouts (sorry demand management).
It’s a terrible situation that’s coming, and more people in the industry need to speak up.