This is the 6th Case Study in a series that explores the 98 tabulated instances (between 2013 and 2019) where Aggregate Raw Off-Target for all Semi-Scheduled plant was in excess of 300MW in either direction:
1) Most of the time (93 of the 98 dispatch intervals) being collective under-performance; but
2) On rarer occasions (only 5 dispatch intervals) being collective over-performance.
This case study focuses specifically on the first of those five instances of over-performance.
(A) Summary results for Thursday 8th January 2015
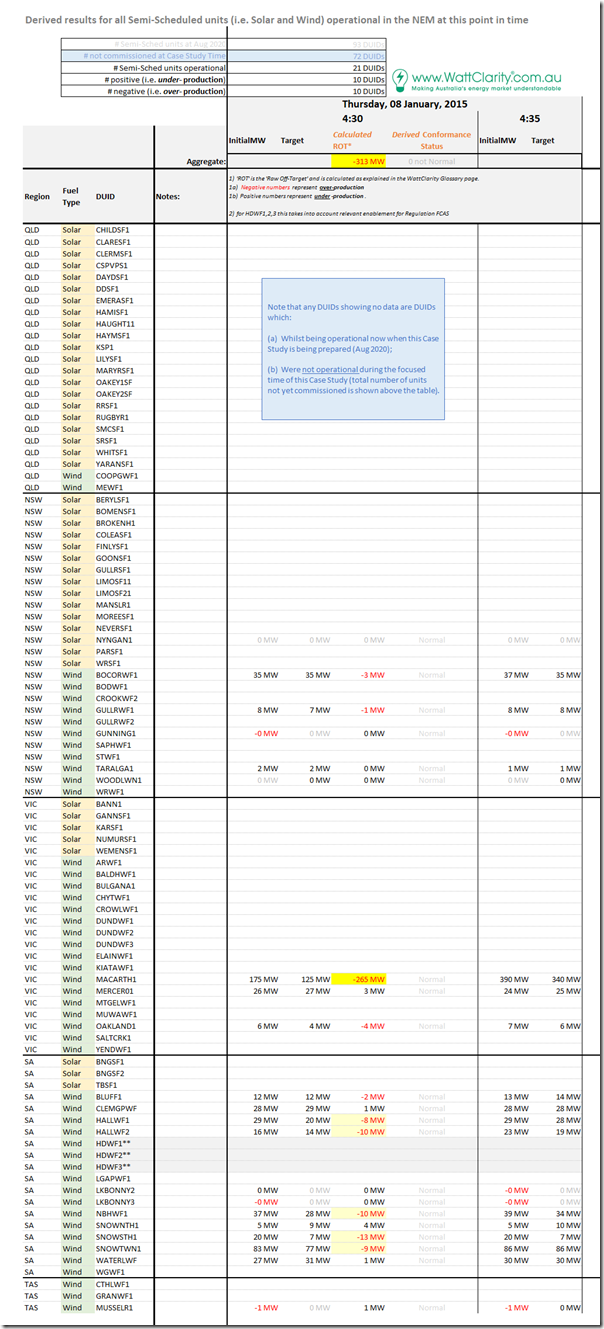
Again, we start with this summary table, highlighting the individual Raw Off-Target performance of all Semi-Scheduled units that were operational at the time:
There’s a few things that can be highlighted here:
1) This period sees Nyngan Solar Farm registered, but too early in the day to be operational – hence the results represent the collective performance of 20 Wind Farms;
2) Of these Wind Farms:
(a) The same number of wind farms are under-performing as they are over-performing
(b) Clearly the large over-performance of Macarthur Wind Farm swamps the results from the other 19 wind farms; though
(c) Worth noting that 5 other wind farms (all in SA) are highlighted has having non-negligible over-performance.
(B) Looking at some specific DUIDs
Again we can show this specific dispatch interval clearly with ez2view, wound back 5 years ago through the powerful ‘Time Travel’ functionality:
(B1) Macarthur Wind Farm in VIC
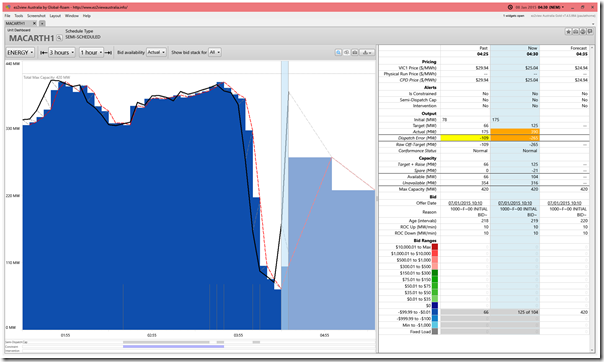
Clearly the largest contributor is the Macarthur Wind Farm in western VIC:
In this snapshot from the ‘Unit Dashboard’ widget in ez2view, we see that the preceding 04:25 dispatch interval saw an over-performance of 109MW, which escalated further to be 265MW in the 04:30 dispatch interval. That’s a pretty significant amount!
Furthermore we see that this followed on from the period immediately beforehand where the wind farm had significantly under-performed in relation to a Dispatch Target which was ramping down.
In other words, we see that (from 04:00) the actual output dropped earlier than (decline of) Target – in the same way that (from 04:25) actual output ramped earlier than ‘predicted’ by the Target.
Keen readers who have been following this run of Case Studies would have noted that Macarthur Wind Farm has featured in a number of them.
This should not be a surprise for those who read this broader summary on 28th January 2020, which named MACARTH1 ‘worst performing’ Wind Farm through 2019 in relation to Raw Off-Target values, using data compiled for the Generator Statistical Digest 2019. The large size of the wind farm is clearly a factor, but it’s likely there are other factors at work here (such as site layout, and location and ???).
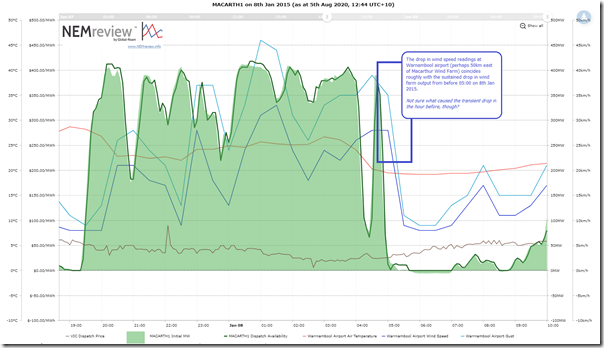
I wondered whether there had been some sudden drop in wind speed, so I produced this trend query from NEMreview v7:
This trend suggests that that, whilst there was a drop in wind speed, it occurred a little later and was responsible for a more longer-term drop in production that began around 04:45. Hence I wonder what the reason was for the rapid decline, and then rapid increase, in output:
Speculation #1 = is it because the sampling cadence of the BOM data we have for wind speed and wind gust might be too coarse for picking up some earlier transient lulls (though the sample cadence is every 10 minutes!)?
Speculation #2 = was there some temporary plant problem that was corrected just as quickly?
Can you help me understand?
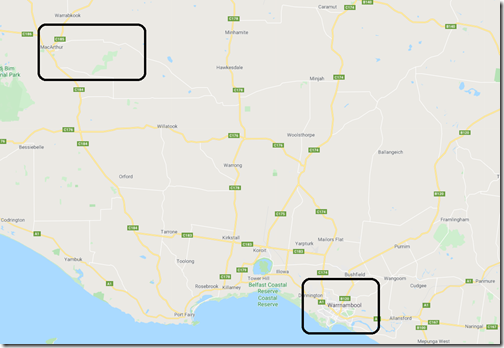
The reason for the slight time shift between wind speed drop and (sustained) output drop I attribute, at least in part, to the difference in the measurement locations:
The wind farm and the Warrnambool airport measurement location look like being approximately 50km apart.
(B2) Hallett 2 Wind Farm in SA
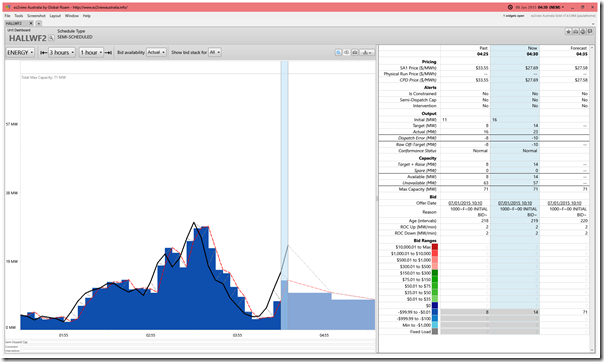
Out of curiosity, I took a quick look at Hallett 2 Wind Farm, which also over-performed (but only by 10MW):
(B3) Hallett 4 (North Brown Hill) Wind Farm in SA
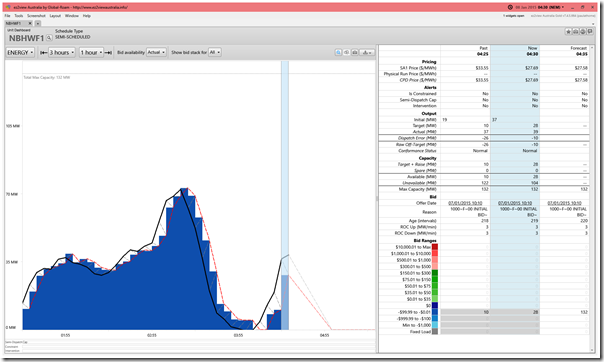
NBHWF1 was another of the three wind farms in South Australia that over-performed by 10MW or more.
In this case it was a 13MW over-performance.
(B4) Snowtown 2 South Wind Farm in SA
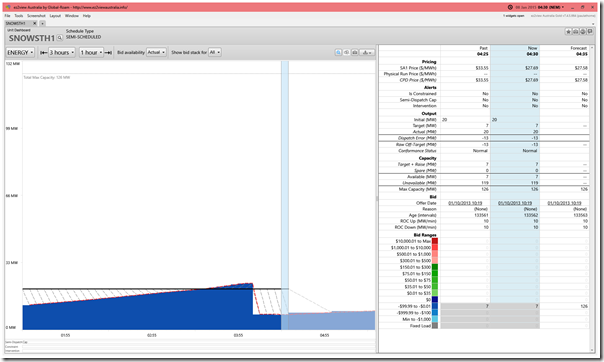
SNOWSTH1 was another of the three wind farms in South Australia that over-performed by 10MW or more:
This profile of operations looks different than the 3 above – with the actual output stuck on 20MW, we see the Target was not seeming to take notice of this.


Leave a comment