I’ve been focused on a couple other things related to the GSD2019 today (fulfilling a number of new orders, and also completing this analysis) but did happen to notice the deep blue colours shown for levels of Scheduled Demand for both the South Australian and Victorian regions today, indicating that they had dropped to the bottom end of their historical ranges.
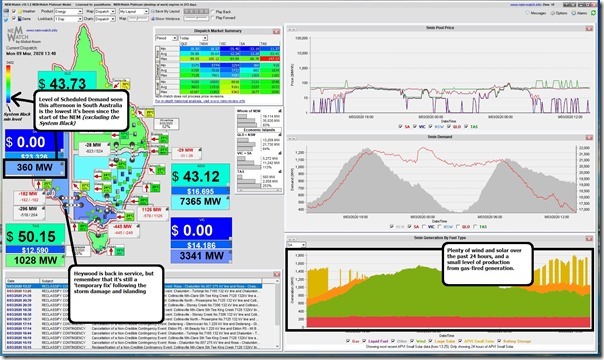
Here’s the 13:40 dispatch interval captured in our handy NEMwatch v10 entry-level dashboard showing the level of Scheduled Demand down at only 360MW:
Not sure why the APVI data feed has been so discontinuous to us in recent weeks – alas, we have not had time to investigate with the APVI.
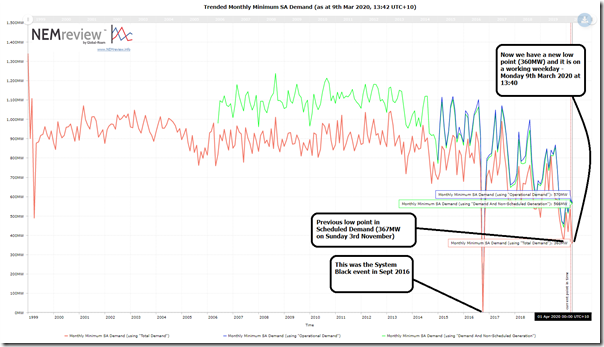
This was the lowest level seen for Scheduled Demand seen since the start of the NEM (excluding the period surrounding the SA System Black event). We can see this in the following record of this trend query from NEMreview v7:
As noted on the chart, this new low level is 7MW lower than the prior low point, which was set on Sunday 3rd November 2019. Hence it is notable that this low point has been reached only 4 months later and on a working weekday.
Obviously we all can understand where Scheduled Demand is headed, so we’d clearly better get some skates on in dealing with the challenges that will come our way during the instances in future as it continues to decline!
Two more points to make:
1) What’s been happening today in South Australia is also interesting from the perspective that SA is still only connected (from an AC perspective) by the ‘temporary fix’ discussed here; and
2) The level of minimum demand in Victoria was also shown to be quite low as well (3,341MW in the NEMwatch snapshot above) but further away from the all-time minimum (2,940MW):
2a) However note that this ‘prior record’ was back at the start of the NEM, when some of the smelter load was separately accounted for as a Scheduled Load.
2b) Hence we would need to dig further to see where this new level was at on a like-for-like basis.
2c) A quick scan revealed this prior article about a level of Scheduled Demand in VIC down at 2,940MW at 04:00 on Monday 2nd January 2017, and back then I called it ‘lowest ever’ with that caveat.
2d) Hence the level seen today (only 371MW higher) is still pretty remarkable for a daytime working weekday – compared with witching hour during Christmas -to- New Year holiday time.
———————-
PS My Mistake
As pointed out in comments below, and also elsewhere online, Monday 9th March was Public Holiday in VIC and SA. This helps to explain the (still remarkable) low level of demand.


Today is a public holiday in SA, VIC, ACT and TAS.
Paul
I suspect you are in Sydney. It was a public holiday in SA and Victoria today. So the low demand, while unusually so, is not unlike a Sunday.
Sun was up, so domestic solar was producing away, at least in Adelaide.
Sorry John, missed that one – my mistake.
25C max and sunny and 16C minm at night in Adelaide was picture perfect for solar rooftop with no aircon demand on a public holiday so you’d expect that’s as good as it gets.