The Generator Statistical Digest 2019 (GSD2019) is a comprehensive, beautifully designed resource
Presenting 10 years history on 304 different units (mostly generators, but also the charging/pumping side of storage facilities) and with a focus on 2019 outcomes is no easy task. The authors of the Generator Statistical Digest 2019 (to be released today) have not only accomplished this – they have used graphics very effectively so that users can quickly find the information they want.
New Metrics, potentially quite powerful
The digest contains several interesting, new to me stats, which I will look forward to exploring in future – perhaps in future articles here. Two particularly jump out at me initially:
1) The “Price Energy Harvest” is an interesting concept. As I understand it, for price outcomes in a given range, this display shows the percentage of volume the unit was able to deliver of its maximum potential output. Where output was unable to be delivered, constraints will be just one of the potential reasons.
2) Another stat that is new to me but I really like is the Connection Point Dispatch Price [CPD Price].
a. It’s the regional reference price (or the physical run price, under intervention) adjusted for the impact of constraints on that particular unit; and
b. It’s shown for each unit, averaged over each month of 2019, which begins to highlight why location is so critical (as much, if not more, than MLF).
Wind Farm Capacity Factors
Wind capacity factors are of ongoing interest. The higher the capacity factor for Variable Renewable Energy [VRE] the less the amount of firming is required. In general technology has improved wind and solar capacity factors over time but a great resource helps.
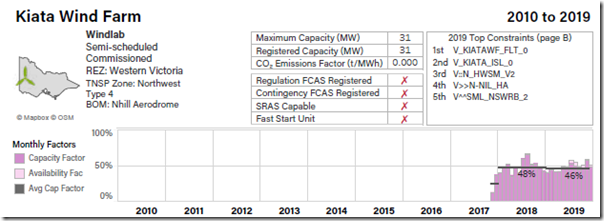
1) As the Digest shows the Kiata wind farm capacity factor was 48% in 2018, 46% in 2019 (including reaching a monthly height of 57% in November 2019). Still its only 30 MW at maximum output.
2) Hornsdale 1 wind farm has been 40% or above in 2017, 2018 and 2019 and achieved a VWA Price of $68.92/MWh.
Batteries
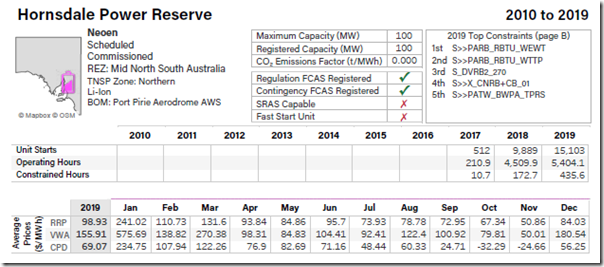
Speaking of Hornsdale, the Hornsdale Power Reserve (100 MW battery) in discharge mode had 15,103 starts (or transitions through 0MW in actual fact) in 2019 (up from approx. 12,000 in 2018) and was running for 5,400 hours (61% of the time) and achieving a volume-weighted revenue through 2019 of $155.91/MWh. These stats are just for discharge of the battery – so exclude revenue earned for FCAS enablement, and also costs of charging.
More importantly its revenue on the generation side for 2019 was about $21M of which $14.6 m was provision of FCAS services. This also excludes the revenue earned from the charging component (another $10.5M earned for FCAS services (mainly lower) – but a cost of $3M for charging).
Its been a very profitable investment so far, at least on a merchant basis. Curiously the Hornsdale Power Reserve, despite being much faster to respond than any gas or hydro generator, is not classified as a “fast start” resource by AEMO.
Macarthur Wind Farm
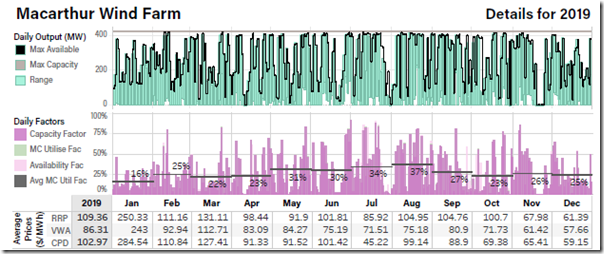
Its also interesting to look at the Macarthur wind farm, the largest in Australia right this second with a capacity of 420MW. Its capacity factor for 2019 was a lowly 27% and it earned $82.4M of pool revenue.
Despite that a 50% interest sold late in 2019 for $880M or 21.4x pool revenue. The sale price reflected the value AGL pays for the output, not the pool revenue. ITK estimates AGL loses about $40/MWh of Macarthur production and will continue to do so until 2038.
Mt Emerald Wind Farm
Continuing our tour around the windfarm pages of the GSD 2019 we note the 29% capacity factor of Mt Emerald in Qld but that its output was strongest in the June quarter and relatively weak in the December quarter. As solar output is strong in Qld in the December quarter and relatively weaker in the June quarter Mt Emerald is a good fit and this shows up in its volume weighted price which at $71 MWh is right in line with the Qld price. Wind in Qld continues to be a good idea if you can find the right site.
Salt Creek Wind Farm
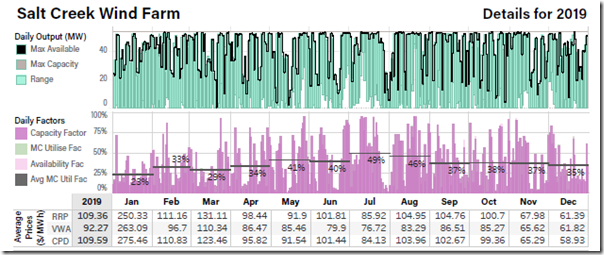
Equally Salt Creek achieved capacity factors of 49% in July and 46% in August on its way to a respectable 37% for the year.
General observations about Wind Farms
In general, the Digest confirms that wind farms in Australia typically have capacity factors around the 35-37% mark. It also shows that in every State other than Queensland, it’s the September quarter and particularly the months of August and September that have the highest capacity factor for each wind farm.
That also happens to be the time of year when demand is typically seasonally low. So this tends to push price down in that period.
That’s what underlies the strategy of seasonally based storage operators such as potentially Snowy 2 where the operators believe they will be able to charge their very large storage reservoir during the September quarter and release during the higher price/higher demand months in the March quarter.
Big returns in January 2019
As a generalization looking through the Digest one can observe that most generators did very well in January 2019 with achieved volume weighted prices during that month often at double what they were able to achieve later in the year. In our view the market should be cautious about projecting January 2019 into future years – it’s a probability game. There will be high priced events and months but not every year and maybe not even most years.
Manildra Solar Farm
Other stats that jump off the page are the 39% capacity factor at the Manildra solar farm in December (up from 16% in June and July).
This shows the potential of “overloading” the inverter or lifting the DC:AC ratio. As panels become cheaper we expect these overloading ratios to continue to rise, to be assisted by bifacial panels and to be supplemented in most cases by some form of DC:DC on site storage. All of this will be done to minimize the direct competition of utility solar with rootop.
Manildra achieved a volume weighted average pool price for 2019 of $81.36/MWh but as with so many generators of all fuels this was heavily biased upwards by January’s $147/MWh (the average price for 8 months of the year was below the annual average).
Loy Yang B Unit 2
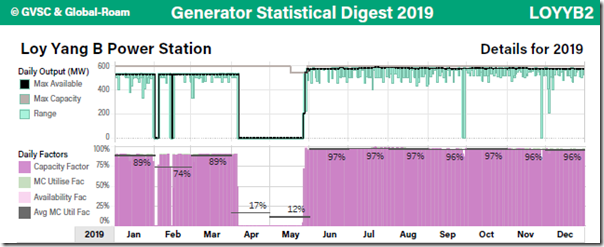
Loy Yang B, a 2-unit brown coal station in Victoria went through a capital refurbishment program designed to marginally lift output and lift reliability. Unit 2 achieved a 97% capacity factor over the next 7 months (which I think must be close to an Australian record for 7 months continuous operation).
In general the station operated far better in 2019 than in any of the previous nine years.
Mt Piper Unit 1
By contrast one of the most troubled NSW stations, Mt Piper had a poor year with Unit 1 managing just a 40% capacity factor in 2019, and Unit 2 at 37%.
Port Lincoln Unit 1
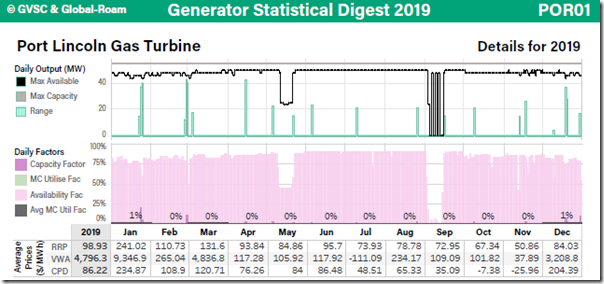
Port Lincoln gas turbine unit 1 achieved a volume weighted average price of $4,796/MWh on its way to earning $4M of pool revenue. I think that must be close to the highest average price achieved by any generator during the year
Pumped Hydro
There are three operating pumped hydro stations in the NEM.
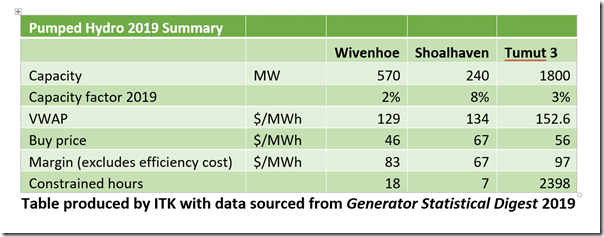
(1) Wivenhoe in Qld is a large (530) MW station located close to the Brisbane load. Its ownership changed from one Qld state organization to another, more renewables focused during the year.
(2) Shoalhaven has 240 MW of capacity owned by Origin Energy which manages an 8% capacity factor in 2019 its highest in ten years.
(3) the more complex 1800 MW Tumut 3 Station part of the Snowy scheme. As the GSD shows Tumut 3 has been increasingly constrained in recent years including 2,398 constrained hours in 2019
The GSD includes separate pages detailing the operation of these three stations in pumping mode as opposed to generating mode. Its not that easy to find information on pumped hydro in pumping mode and so this is valuable information in and of itself.
The case for Tumut 3 in the Snowy Scheme is more complex, as the pumping capacity is only 600MW (DUID = SNOWYP) whereas the production capacity is 1800MW (DUID = TUMUT3). Nevertheless, the GSD enables us to calculate the margin between the price paid for pumping and the price achieved on output.
The table doesn’t show the round-trip efficiency which is typically say 70% for these stations and means that they have to pump say 4 hours for every 3 they generate. Not everyone realizes that as a general statement the round trip efficiency of batteries is way better than for pumped hydro.
What I conclude from the data is that for whatever reason pumped hydro is not playing much of a role in the NEM at the moment.
In popular conception as the daily duck curve becomes stronger due to ever increasing behind the meter penetration pumped hydro will buy the energy cheaply in the middle of the day, pump it to the reservoir and release it during the evening peak. Right now that just isn’t happening. The pumped hydro units aren’t operating much at all.
Wivenhoe’s numbers are the aggregation of two units. In fact the second unit basically didn’t operate in 2019.
——————————————–
About our Guest Author
 |
David Leitch is Principal at ITK Services.
David has been a client of ours (and a fan of NEMreview) since 2007. David has been a long-time contributor of analysis over on RenewEconomy, but this is only his first article published on WattClarity! David did provide valued contribution towards our GRC2018. David has 33 years experience in investment banking research at major investment banks in Australia. He was consistently rated in top 3 for utility analysis 2006-2016. You can find David on LinkedIn here. |



Leave a comment