
As the Australian renewable energy market reaches a turning point in its development cycle, the diversification of wind production has become a key consideration for investors and policymakers seeking to maximise investment in wind energy, while minimising regional and portfolio wind power variability.
At the system level, new interconnectors and Renewable Energy Zones (REZs) are intended to (among other things) help smooth the variability of renewable energy supply by expanding the market for excess renewable energy production and supplying additional energy during periods of low wind and solar production.
At the same time, many investors have turned to portfolio smoothing to levelise production and earnings variability, and improve resilience to adverse conditions, under the assumption that if it is not windy in one location it will be windy in another.
The increasing importance of wind correlation
The strength of wind diversification within a portfolio (or region) is commonly measured by the degree of wind resource correlation between facilities. Correlation statistics have therefore become crucial for investors to measure risk – such as portfolio dependence, project exposure to revenue risks (such as revenue cannibalisation caused by correlated wind or solar production pulling down spot prices) and curtailment risks (associated with energy security and/or transmission congestion).
Recent analysis in the Generator Report Card 2018 by Global-Roam and Greenview modelled wind speed correlation between REZs (based on the nearest weather station) over an 11 year period to 31 December 2018. As shown in Figure 1, analysis found generally strong correlation, particularly through NSW, with few findings of anti- or negative-correlation, where average wind speed increases in one REZ while decreasing in another.
Figure 1: Wind speed correlation by REZ
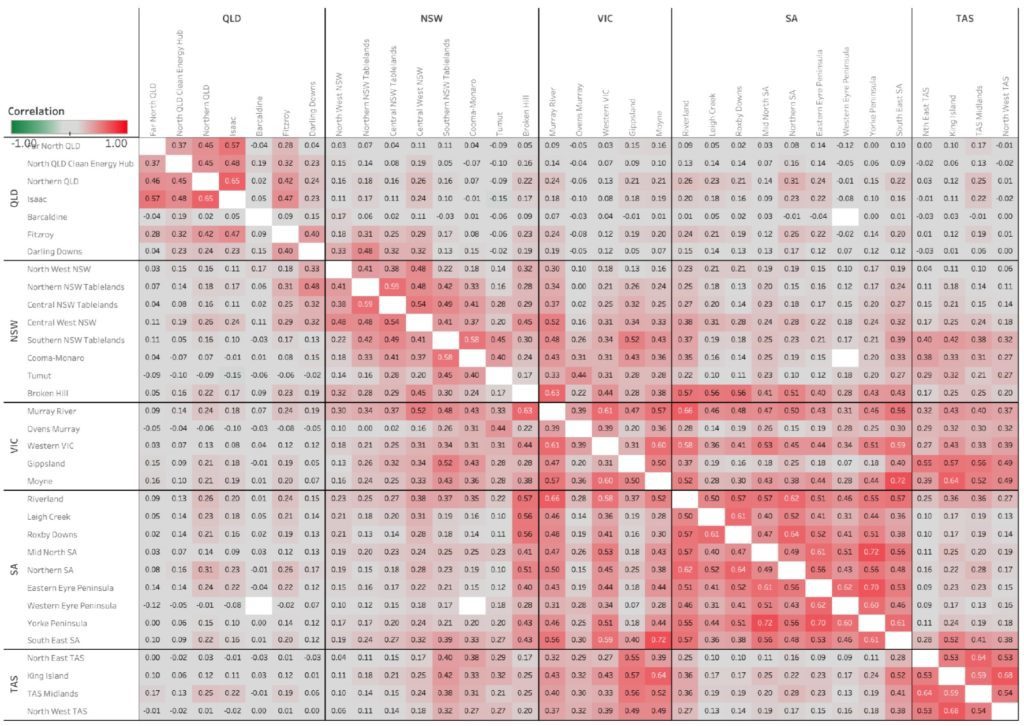
Source: Global Roam/Greenview, Generator Report Card 2018, published 31 May 2019. Large image.
Readers should note this prior article that describes the three general states possible with this correlation function.
Given the generally positive correlation of wind across REZs, analysis noted that the future build out of ‘geographically diversified’ wind farms would do little to change the underlying characteristic of the system, while transmission links between regions that are positively correlated may be sub-optimal if they experience similar weather patterns.
Correlation versus meteorological dependence
While correlation analysis is a key part of project/portfolio and system analysis, it does not tell the whole story of wind relationships across different regions, with little context for how specific weather patterns may be driving wind correlations at a place and point in time, or how system-wide correlations change under different weather patterns (and how frequently these patterns occur).
While the features of large-scale weather patterns inform day-to-day variability in wind speed, meteorological dependence between wind projects (i.e. the degree to which different projects are harvesting the same weather patterns) is not widely considered in investment decision making due to the complexity and scale of required processing. Recent advances in data science and computing, however, have led to the development of more sophisticated models to analyse increasing volumes and velocity of meteorological data.
Earlier in the year we released our advanced analytics model, EnerRISK (energy variability risk), which models the link between large-scale weather patterns and site-level wind production. EnerRISK applies data science techniques to identify the dominant meteorological regimes that drive low- and high-wind periods across different regions, drawing on climate forecasting systems to model long-term change in atmospheric conditions – and wind production.
Building on Global Roam and Greenview analysis, insights into how different weather patterns impact wind production, and force changes in underlying spatio-temporal correlation, has the potential to add depth to the analysis of metrological risk across the energy system, and within individual regions and portfolios.
Linking wind REZ production to weather patterns
Drawing on our EnerRISK model, below we depict average diurnal wind speed for REZs in southern Australia in 2017-18, averaged over the hours aligning with six dominant meteorological patterns across the region, identified in our earlier White Paper.
Each pattern has a different frequency of recurrence (refer to the brackets next to each heading), with the combination of all six patterns representing the average diurnal wind profile for all hours. Key notes:
- Analysis encompasses all REZs across southern Australia, including non-wind REZs such as hydro REZs in eastern VIC and southeast NSW, and solar REZs in northwest Victoria and eastern SA, included for comparative purposes;
- Note the changing scale of the y-axis (wind speed), with patterns 1, 2 and 6 representing strong wind clusters, while patterns 3, 4 and 5 represent weaker wind
Figure 2: Average diurnal wind speed by REZ (by weather pattern)
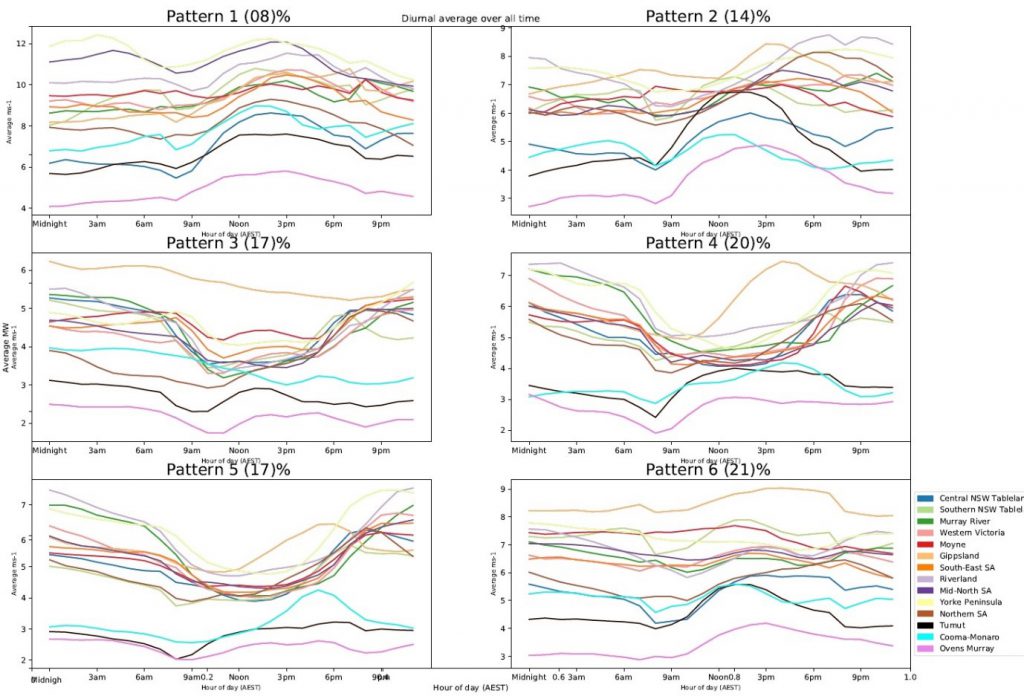
Source: RepuTex Energy (EnerRISK), 2019. Large image
Breaking down wind output in line with the weather patterns that drive production enables the deeper analysis of seemingly random generation patterns, helping to inform a range of analysis, such as wind-ramps, price variability or storage opportunities.
For example, as noted in our earlier White Paper, windy patterns 1 and 2 (cool and warm storm patterns) are identified as capturing the lowest regional prices in SA and VIC, reflecting the cannibalisation effect of wind generators operating near their rated capacity, pushing the electricity supply curve to the right and pulling regional clearing prices lower. Comparably, in times of low wind (patterns 3, 4, and 5), regional prices are generally higher to support higher marginal-cost generators, e.g. gas-fired.
We also gain a deeper understanding of how different weather patterns drive diurnal wind profiles. For example, in Figure 2 we see two distinct diurnal profiles in line with low and high wind periods – and more specifically – under sunny and cloudy conditions. In cloudy patterns associated with storm activity, we see patterns 1, 2 and 6 have higher wind speeds (note the changing y-axis). Comparably, during sunny conditions we see patterns 3, 4, and 5 have depressed winds, particularly during daylight hours, ramping up in the late afternoon- evening. This could indicate opportunities for the co-location of wind and solar, particularly in regions where these patterns recur more frequently.
How do weather patterns impact REZ correlations?
In Figure 3, we depict diurnal wind speed correlation between REZs, broken down by weather pattern (note analysis maps diurnal correlation and is therefore not directly comparable to Global Roam). Results are clustered into regions, with stronger positive- negative relationships (over all hours) grouped together, to more clearly depict interactions between different regions.
Figure 3: Diurnal wind speed correlation by REZ (by weather pattern)
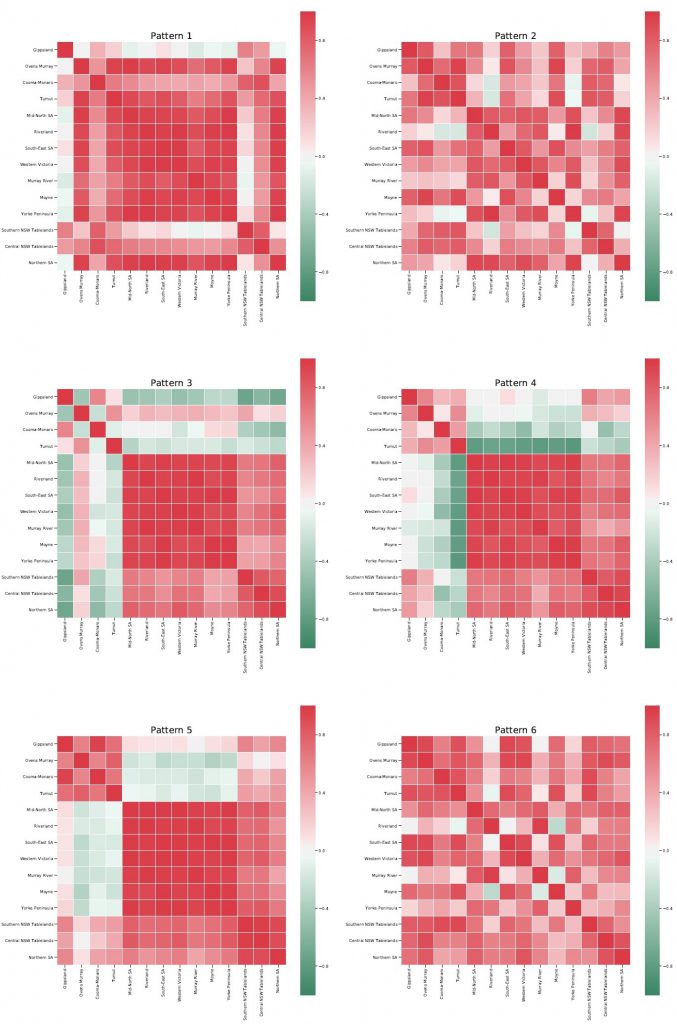
Source: RepuTex Energy (EnerRISK), 2019. Larger image.
When wind correlations are categorised by weather pattern, we gain an alternative view of regional wind relationships, with areas of anti-correlation (in green) visible under clear sky associated weather patterns.
For example, under high/steady wind (very low prices) in Pattern 1, we see most regions are positively correlated (as expected), yet with pockets of anti-correlation for wind resources in eastern REZs, such as Gippsland and the Southern NSW Tablelands. Anti- correlation for these regions is not necessarily a silver bullet, however, with the benefits of diversity (for investors or the grid) during these hours offset by strong wind production across most regions (see Figure 2).
Under Pattern 2 (gusty winds, low prices), we again see positive correlations, but weaker relationships between South Australian and Victorian REZs, largely attributed to more southerly storm winds during warmer weather conditions. A similar profile is seen under Pattern 6 (moderate winds and prices).
Within patterns 3, 4, 5 (lower winds and higher prices), we see similar shapes – with anti- correlation again visible in eastern REZs, e.g. Gippsland and southwestern (hydro) REZs – and much stronger correlations between western Victoria and eastern South Australia regions. Unlike Pattern 1, anti-correlation during these hours may represent a larger benefit (for investors and/or system reliability) given the lower relative wind speeds across most wind-REZs, and higher regional prices.
Implications for system diversity and portfolio risk
Wind speed and direction is highly dependent on metrological conditions. We therefore see significant differences in correlation when regional circulation patterns are used to re-categorise analysis of market and system risk. The framing of how and when meteorological factors impact wind correlations (and how often these patterns change under future atmospheric conditions) is therefore of high value for decision makers.
For example, by understanding the interaction between weather patterns and wind correlations, market operators and policymakers can quantify the resilience of future highly renewable energy regions as more renewables are integrated into the system, while better estimating performance under extreme adverse weather conditions.
For investors, a deeper understanding of meteorological risk within portfolios is also of considerable benefit to the analysis of portfolio resilience, helping to inform the degree to which different wind projects harvest the same patterns, and the magnitude of a portfolio’s risk (or resilience) to future changes in metrological conditions.
About our Guest Author
|
|
Established in 1999, RepuTex is a leading provider of advanced modelling services for the Australian electricity, renewable energy and emissions markets.
Our forecasts and analysis have been at the forefront of energy and climate thinking for over two decades, with a strong history of providing trusted, data-driven analysis for public and private sector customers in Australia and Asia. Find out more about RepuTex Energy here. |

Be the first to comment on "Insights: How do weather patterns impact wind REZ correlations?"