I was invited to speak in the “Market & Technology” session at today’s “Queensland Smart Energy Summit” in Brisbane – but unfortunately last minute complications means I can’t be there today.
For today, I was looking forward sharing some of the insights we generated about Storage in our recently completed Generator Report Card (which we completed in conjunction with Jonathon Dyson and his team at Greenview Strategic Consulting). It seemed appropriate to speak about storage under a “Market & Technology” session, given several factors, such as:
(a) The prior investment we had made in working with the Smart Energy Council and exploring the development of a small-scale Energy Storage Register; and
(b) How, because of the intermittent nature of the wind and solar being the two technologies of choice being deployed in this energy transition (as assessed in Theme 10), energy storage – small and large – is going to play a crucial role;
(c) But also because too many people seem to latch onto Storage as a “magic wand” – in other words, a technology that is presumed to be able to save us all from challenges emerging from the deployed plant mix, but doing so without really assessing how (and if) it might actually be effective.
Thankfully Jonathon Dyson happened to be in Brisbane at the event today and has offered to stand in for me on the session (indeed he will be better than me at sharing some key lessons about large-scale storage, given his experience in helping with commencement of operations at Hornsdale Power Reserve and a number of other large-scale batteries in the NEM).
Jonathon’s going to present on his own perspectives – but, in addition, I thought I would share some insights on WattClarity here today:
(A) Its early days for Energy Storage
In Part 2 of our Generator Report Card (part of the ~170-page analytical component) we included some discussion about storage under Theme 11 where we note that it’s only “early days in the ramp up of energy storage” (where actual contribution is lagging the volume of buzz it seems to be consuming in the public consciousness at present):
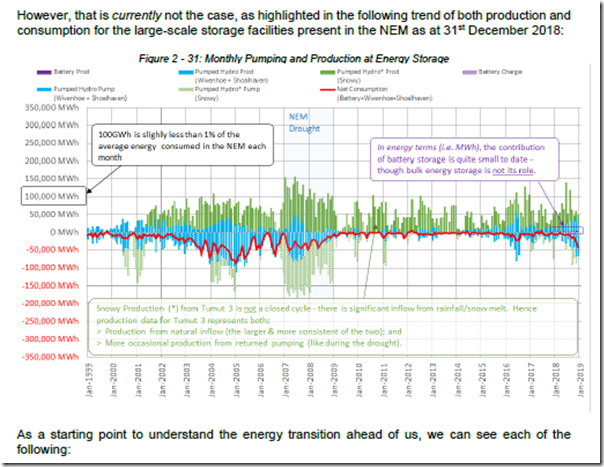
We illustrated this by providing the following 20-year trend of the utilisation of hydro and battery storage facilities across the NEM. In the following trend monthly production is shown above the line as a positive number, whilst consumption (i.e. pumping/charging) is shown below the line as a negative number.
The NEM has had access to three pumped storage hydro facilities (Wivenhoe, Shoalhaven and Tumut) for all of its 20 year history – yet we see that these have only supplied more than 1% of the average energy consumed in the NEM for only a handful of months since the start of the NEM.
Battery storage is the new kid on the block, with its bulk energy supplied shown highlighted in purple from late 2017. It’s clear from the chart that its contribution in energy terms has been an order of magnitude smaller than even the hydro schemes. This should not be a surprise to anyone, as the purpose of these batteries is not* for bulk energy storage but rather like the shot of adrenaline in the heart of the NEM at those important times in order to buy a little time for the heavy artillery to arrive and keep the heart going, longer-term.
* perhaps more correctly we should say “not currently” or “not currently, and not for the next decade” because herein is the inherent challenge – for the NEM to operate with large percentages of energy supplied from intermittent solar, and with the assumption that storage will be available to bridge the gap between supply and demand, we need to understand the scale of the numbers we are talking about and just simplistically assuming it to be that magic wand.
What is apparent to us (as discussed in the Generator Report Card) is that:
1) the history of the NEM has provided an environment in which the business models that support storage have not been based on bulk energy storage; and yet
2) that seems to be the role that will be required for the NEM in future years, after more legacy dispatchable plant has been retired and significantly larger volumes of energy are being produced of the ‘Anytime/Anywhere Energy*’ form.
* the terminology ‘Anytime/Anywhere Energy’ is discussed in Theme 5 within Part 2.
We wonder whether more could be done to prepare the NEM for this future – and wonder what role organisations like ARENA might play in this?
(B) Results for Hornsdale Power Reserve through to 31st Dec 2018
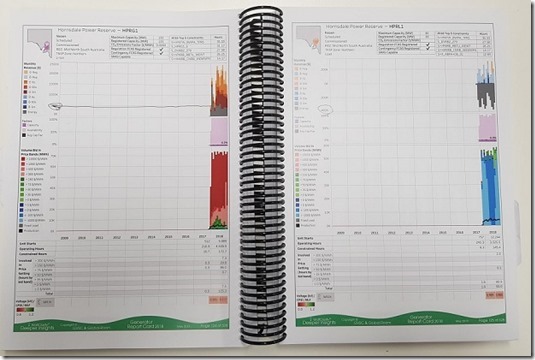
Within the Generator Report Card, in addition to the ~170-page analytical component, we also included a 328-page Statistical Digest as Part 3 in the mammoth report. In this section we included a page for every DUID (i.e. unit) that had operated in the 10-year period ending 31st December 2018.
What this meant was that there was a 14-month history shown for the Hornsdale Power Reserve given it began operations at the end of November 2017 as the first large-scale battery in the NEM. Results for HPRG1 (the generation component) and HPRL1 (the pumping/charging component) are shown on adjoining pages, as shown in my (increasingly annotated and dog-eared) copy of the Report:
It’s particularly informative to pull out three pairs of illustrations and compare them in series below:
(B1) Revenues for Hornsdale Power Reserve
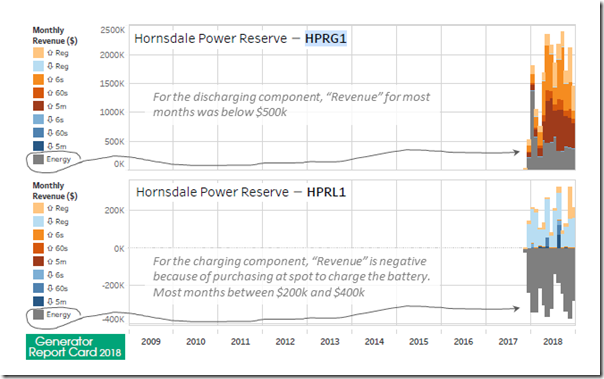
For ease of readability I have combined the monthly revenue trends for HPRG1 (the generator) and HPRL1 (the load) one on top of the other in the following illustration from the Generator Report Card:
These trends are useful in discussing the three key revenue sources that this particular battery earns:
Revenue Source #1 = Energy Market Arbitrage
As highlighted in the image, the battery earns revenue from energy market arbitrage on a “buy low, sell high” strategy. In simple terms (i.e. without going down the path of exploring revenue from derivatives) this is the underlying way that all storage facilities need to earn money in the energy market – because they do not, in-and-of-themselves generate energy.
Understanding that this battery has paid something between $200,000 and $400,000 each month to charge the battery – and yet rarely earned $500,000 in a month to discharge should help to reinforce the challenges in making this type of business model pay for a large capital investment….
Revenue Source #2 = FCAS Revenues
… this is especially the case when we compare to the monthly revenues earned across each of the 8 x FCAS markets.
Those readers not intimately aware of Raise/Lower Regulation/Contingency FCAS markets would do well to review this introduction to FCAS penned by Jonathon Dyson (a very widely referenced article) along with the follow-up article here. There is also a case study penned by Allan O’Neil about “What happens when a generator trips” that helps to explain how various facilities contribute – including the Hornsdale Power Reserve.
With this background, readers should understand why Hornsdale Power Reserve mostly:
(a) Earns revenue from Raise service on the discharge side of the battery; whilst
(b) Earns revenue from Lower service on the charge side of the battery.
It should also be apparent that there is some complex co-optimisation that can be attempted by the asset operator across all 9 commodities.
(a) “Set and Forget” is definitely not an option for battery storage operators – and is also fast fading as a realistic option for operators of wind farms and solar farms.
(b) We see it as unfortunate that the form of support for new supply from wind and solar projects (i.e. because of a focus on ‘Anytime/Anywhere Energy’) has, in effect, paid some new entrants to remain naive to some of the complexities of the grid.
(c) This lack of understanding risks becoming an broader industry capability gap that will stunt our ability to effectively solve the vexed challenges relating to storage.
Readers might recall of other articles written elsewhere about how “the Tesla big battery has smashed the oligopoly in the FCAS market, and reduced prices”. Astute readers should also draw from articles like those another underlying challenge inherent in trying to scale up storage capacity in the NEM and fund it from FCAS revenue – if a 100MW battery in South Australia has done that, what happens to prices as more and more storage facilities enter the market (tip = prices crunch further, killing the business case for their entry).
The FCAS market is a shallow market and should not be viewed as a magic pudding that will continue to support the entry of.
In this WattClarity article I don’t want to get distracted by various discussions currently underway about expanding the FCAS markets in various ways – such as by the introduction of Fast Frequency Response (FFR). That’s food for a later discussion.
Revenue Source #3 = Payments from outside of the market
It’s very* public knowledge that the Hornsdale Power Reserve only came to be after some very public support from the South Australian Government. However the specific terms of the agreement between the parties (Tesla, Neoen and the South Australian Government) and the nature of payments made are commercial in confidence – and understandably so, though others have tried to unwind public filings to ascertain.
* “very public knowledge” = you’d have to be living under a rock not to have heard of the ‘billionaire’s negotiations via Twitter’.
The specifics of this particular case are not the main point here – rather we highlight this to wonder the extent to which ‘outside the market’ payments are going to be necessary in some form to support the development of most of the storage that needs to be developed as discussed above.
It will be interesting to watch how the NEM evolves in the months and years ahead with respect to these three separate revenue streams for storage.
The analysis we prepared for the Generator Report Card certainly showed there are challenges to be solved!
(B2) Capacity Factor for Hornsdale Power Reserve
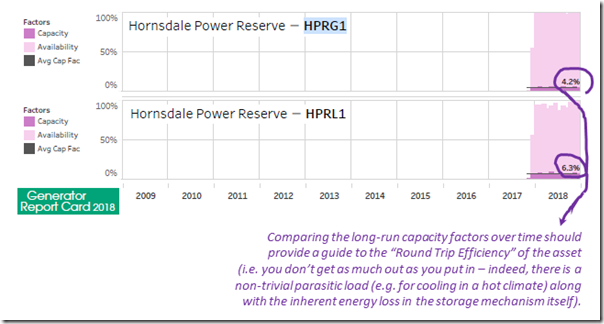
Juxtaposing the second chart from both of the Part 3 pages in the Report Card, we can see an important picture emerge in terms of the round-trip efficiency of the asset:
More experienced analysts will understand the inherent challenges in deriving a seemingly precise view of volume of energy produced and consumed where all we have to work with at the start are somewhat imprecise SCADA snapshots of instantaneous rates labelled “Initial MW” in the MMS (within Theme 14 in Part 2 we outline a number of different ways in which the NEM is crying out for greatly enhanced analytical capability).
Notwithstanding the possible inaccuracies in compiling numbers in this way the picture above does remind us that storage facilities (pumped hydro, batteries, and other) all consume more energy than they return. This is one of the factors that feeds into the energy arbitrage strategy invoked by the operator in order to make a return (i.e. the spread between “buy low” and “sell high” has to be enough to justify the loss of energy).
We will be particularly interested to assess any change in the operational profile of Wivenhoe Pumped Storage Hydro in the months after CleanCo commences operations, in order to learn more about whether the low utilisation of the plant has been more to do with physical constraints (like round-trip efficiency) than it has been with claims of portfolio effects.
(B3) Involvement in setting the Price for Hornsdale Power Reserve
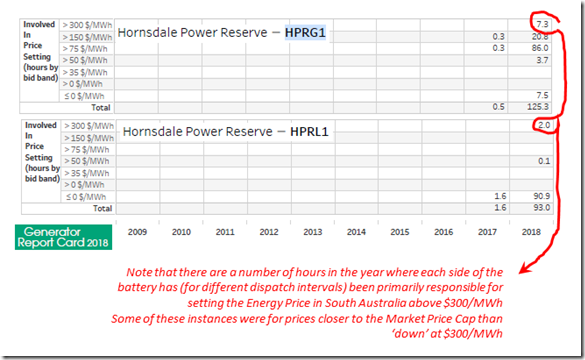
Each of the pages in Part 3 contains more detail than we have time to cover in this analysis today (e.g. bidding strategies, operating hours, starts and constrained hours), but we wanted to focus on involvement in setting the price for the last of three exhibits:
Those readers not intimately aware of the arcane details of NEMDE and the dispatch process would be wise to refer to our prior Beginner’s Guide and the follow-on Intermediate Guide to how Prices are set in the NEM – and also this related article by guest author Allan O’Neil about price setting concepts.
In the Generator Report Card, we simplified the multi-dimensional nature of price setting down to a simpler concept of (dominantly) “involved in price setting” (for Energy, in the host Region). Specific details of how we achieved this simplification are described in the Glossary in the Report Card (i.e. Part 5).
1) From the table above we can see that HPRL1 was mostly involved in setting the price when it was low (indeed, at-or-below $0/MWh) whereas HPRG1 was mostly involved in setting the price where it was in the range between $75/MWh and $300/MWh. This fits with the “buy low, sell high” arbitrage principle.
2) However it is also worth noting that both sides of the battery were involved (at separate times) in setting the price at some times when the price was above $300/MWh – in some dispatch intervals well on the way to the Market Price Cap. It is only reasonable to understand that this would be a natural outcome of tight supply/demand balance and scarce energy availability – however these real world realities might not be apparent to some more simplistic energy sector observers.
(B4) For a live view of Hornsdale Power Reserve
At Global-Roam Pty Ltd, we’re pleased to assist a number of parties with the measures arising out of the Government’s response to the SA System Black event.
Amongst other initiatives we are please to be able to provide real-time visibility of how the Hornsdale Power Reserve is operating (in collaboration with Neoen) with the widget located at the bottom of their website here – and also embedded below:
The widget shows prices for Energy and Raise/Lower (Regulation) FCAS services – along with charge/discharge rates in MW.
Note that it’s no charge to embed this widget on 3rd party websites in the same way as above (just click on the “Embed” button and follow the instructions).
(C) Anything new shown into 2019?
Since we released the Generator Report Card (on 31st May 2019) we have been inundated with interest from a wide range of parties (some early feedback was recorded here). Great to see it being referenced in a broad range of places – such as in this ABC news article yesterday.
One of the questions* we’re commonly asked about the Report Card is whether (and when) we would be considering preparing an update.
* that’s not the only question we have been asked – indeed, we previously wrote about these 5 other commonly asked Questions.
Short answer to the question is that we’re not exactly sure what we might do, and when – beyond saying that we definitely won’t be repeating the whole exercise every year complete with 170 pages of detailed analysis. It just requires too much investment that would detract from the focus on implementing the insights we’ve already drawn into our software (with a particular focus currently on ez2view).
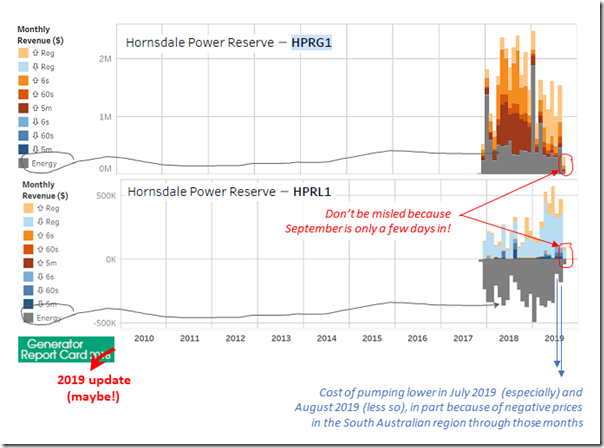
Partly because of this Question, but moreso because it proves an effective means of answering a number of questions we find ourselves asking, we are periodically re-running updates to the Part 3 production process in order to see the latest data – including the following updated revenue chart for Hornsdale Power Reserve:
There’s been a bit of talk recently about the negative prices experienced in recent times (though in terms of WattClarity articles moreso with a QLD focus in recent times).
This article showed that the CAL 2019 year (even just till late August) experienced more dispatch intervals experienced prices at or below $0/MWh in South Australia since 2016 – and (already) more than most other years. Interesting, then, to see that the cost of charging at HPRL1 was substantially lower in July and August 2019 – however we also see that mid-2018 saw a drop in the cost of charging so would not get too carried away.
(D) Integrating lots of storage for the future
One final (brief) note that we have heard in different forums and from different people a complaint that runs along the following lines:
I have (or will have) a Semi-Scheduled Wind/Solar facility that is increasingly becoming constrained down, so I am losing production – and hence the Black and Green revenue components. I have (or am thinking about installing) a storage facility on the same site – yet I understand that I cannot directly charge my facility with the energy foregone….
(or words to that effect)
Unfortunately I have run out of time today to outline the shortcomings in the over-simplistic nature of this mindset (at least in part of the special licence available to Semi-Scheduled assets in the NEM).
This was further discussed in Theme 13 within Part 2, and we understand that rule changes might be afoot. We look forward to seeing hybrid registrations roll out in future, though note that this will require increased sophistication on the part of the asset operators.
As we note in Theme 14 within Part 2, we all need to wise up for this energy transition to succeed.
————————
Oh, and despite the fact that we have parked our investment in a small-scale Energy Storage Register we still very much recognise the merits of a national Register of Distributed Energy Resources and will watch with interest as the AEMO project is rolled out.


Interesting discussion about storage.
Meanwhile Basslink is out of action again and won’t be back online until end of October.