
Our co-author (Jonathon Dyson of Greenview Strategic Consulting) and I are speaking this evening at an event organised in Sydney by the Australian Institute of Energy, providing some context from our Generator Report Card about what the 20 years of generation history we’ve just clocked over in the NEM might tell us about what could happen over the next 20 years:

For those who can’t be there (I’m told the event is sold out) I agreed to post some of* the presentation we’ll be walking through this evening
* note that what I can post here is limited primarily because we’ll be investing most of the time walking through parts of the 530-page document itself, particularly in response to questions we’re asked by the audience.

Because the Generator Report Card is so deep, and so broad, in terms of the analysis completed and insights conveyed, it’s not possible for a pre-canned presentation to properly convey all that it entails. Hence our keenness on seeing where audience questions take us – after setting the scene.
In order to provide some context to this more interactive Q&A, I thought it would be useful to answer 5 of the most commonly asked questions we have consistently heard since (or even before) we released the Report Card on 31st May 2019 – less than 3 months ago now:

Q1) Why did we invest the ~10,000 hours in developing the Generator Report Card?
That’s a very good question (and one we asked ourselves a number of times as weeks stretched into months earlier this year as the analytical effort rolled on!).
In reality, there are a number of different answers to the question, each of which is relevant – and each of which is important in their own way.

Four of these answers are shown here:
Reason #1) Because the NEM has reached a 20 year milestone
It’s hard to believe in a way, but it’s been a little over 20 years since the NEM first commenced at the end of 1998 (and almost 20 years since our company has been in operation in helping clients make better decisions – by making complexity understandable for them).
Given the 20 year anniversary, it seems a great opportunity to look back over the 20 year history, in order to see what can be learnt (what the data is actually telling us) that might help to inform views of what might be coming down the wire for the next 20 years – both risks, and opportunities.
Note that we have found it a little strange that none of the official organisations who we might think might be entrusted to do something like this seemed to be organising to deliver something like this – but then, on the flip side it’s represented a commercial opportunity for us (and our customers have thanked us for investing the time).
Reason #2) In response to confusion, misunderstanding (and what seems some pretty shallow analysis on occasions)
Especially as this energy transition gathers pace (but also compounded by the natural attrition of organisational experience as older hands have progressively exited the industry, and due to increased complexity in the industry, and for other reasons as well) we have witnessed what seems at times to be increasing levels of confusion and misunderstanding amongst the growing pool of those directly involved in the wholesale market – but also in the much broader (and perhaps even more rapidly growing) group of spectators, observers and commentators on the wholesale market.
The term “energy expert” is a greatly over-used, and abused, term (and I am not claiming to be one of them).
Rather, we are intensely interested in understanding what an objective and detailed view of the data actually shows – warts and all.
Reason #3) As intensive R&D for our software
Over the (almost) 20 years we have been serving our clients, our software (i.e. the primary means by which we serve) has come a long way. However we know that we have much that still needs to be done to meet our client’s emerging challenges in the years ahead.
Initiating this Generator Report Card process was a legitimate “excuse” for us to focus on a very intensive period of research (leading into a development phase we have moved into) in order to ensure we continue to help clients to meet their needs (and, in some cases we hope, meet their needs even before they are generally aware of it.
Some of the insights generated through this process did not make their way into the report itself, for a variety of reasons. Rather we’ll look forward to delivering them through software like ez2view (and to a more limited extent NEMreview and NEMwatch etc) in the weeks and months ahead.
Reason #4) Because we’re just naturally insatiably curious.
This was not the main reason why we did it – though it sure did help through some very long weeks as we struggled with some of the more complicated things we were trying to do with an AEMO MMS Data Set that really is not fit-for-purpose in terms of some of the things we are trying to do.
Across the two main organisations, we appreciate having people onboard who are naturally inclined this way (and the external analysts helped as well), and would certainly welcome others if they could let us know of their interest.
Other reasons…
Those 4 are not the only reasons – there are others we might shed light on in future (or perhaps keep to ourselves).
If you have any questions about this, please let us know.
Q2) What is the Generator Report Card?
For those who purchase the Generator Report Card, they receive a hard copy of the Report, and also access to the electronic PDF that they are welcome to use across their organisation:

Inside the report itself is essentially two separate (but complementary) pieces of value – there is ~170 pages of analysis across Part 2 and Part 4, and there is 328 pages of stats (condensed down to 1 page per generator – each page encompassing millions of points of data):
| ~170 pages of Detailed Analysis | 328 pages in a unit-level “Generator Statistical Digest“ |
| Using the extensive 20-year history of NEM generation we have assembled in a transformation of the AEMO’s MMS database (plus some additional data from the Clean Energy Regulator and the Bureau of Meteorology) we have performed numerous discrete pieces of analysis – many of which could warrant a separate report in their own right.
Rather than split these pieces of analysis separately, we deliberately chose to include them all in this Generator Report Card to reflect the holistic nature of the challenges inherent in this transition. We chose to split this analysis between:
|
Included as Part 3, we have compiled a rich statistical page for every DUID (i.e. unit) in the NEM for which there was operational data within the 10 year period to 31st December 2018.
This covers both: The structure, and content, of each of these pages in the Statistical Digest are explained here . |

On WattClarity, we have posted already a number of different articles referencing some of the Themes contained in Part 2 – as just 60 of the 110 pages of analysis:
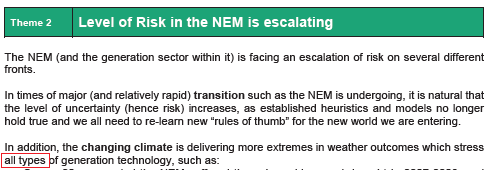
| Theme 2 | In Theme 2, we explore a number of different ways in which of “The level of Risk in the NEM is escalating”.
For instance, on 9th August 2019, we posted this article that spoke to some of the analysis contained within the Report Card (but pertaining to what was reported in some of the media reports related to pricing patterns occurring at the time). |
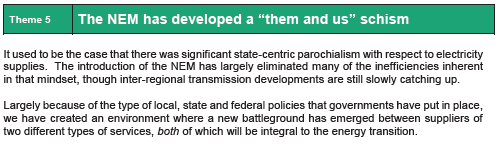
| Theme 5 | In Theme 5, we explore how “the NEM is developing a them-vs-us schism” – with a particular focus on why this has come about, and what the implications
This schism was discussed briefly in this article of 8th August 2019 (and even as far back as August 2014) – and was also mentioned in Giles’ initial review of the Generator Report Card. It will be explored further in future articles on WattClarity here. |
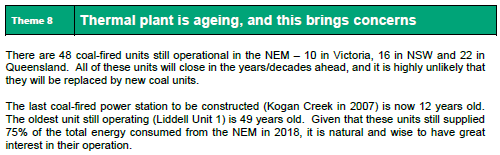
| Theme 8 | In Theme 8, we explored a number of different aspects of “Thermal plant is ageing, and this brings concerns” with a focus (intentionally) heavier on coal than gas, given the much larger share of energy generated by coal-fired plant in the NEM in calendar 2018:
For instance, on 14th June 2019 we posted this article that included some introductory trends included in Theme 8 within Part 2 of the Report Card (noting that there were another 38 pages included in Part 4 about different measurements of the “dependability” – or not – of thermal generation). |
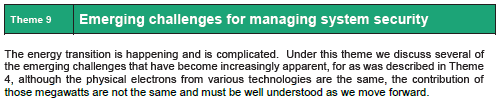
| Theme 9 | In Theme 9, we explored a number of different aspects of “Emerging challenges for managing system security” in Australia’s National Electricity Market (NEM)
For instance, on 12th August 2019 we posted this article including excerpts from this Theme within the Report Card, highlighting calculated values of inertia supplied by synchronous generation. |
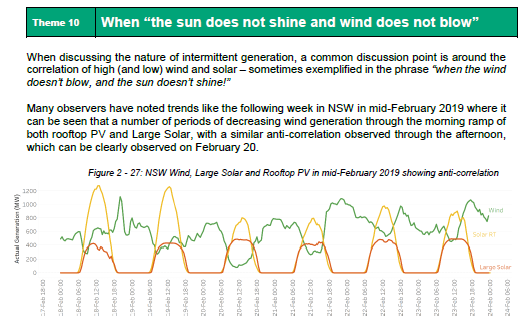
| Theme 10 | In Theme 10, we explored the challenges inherent in times “when the Sun does not shine and Wind does not blow” across all Renewable Energy Zones defined in AEMO’s Integrated System Plan 2018:
For instance, on 26th July 2019 we posted this article highlighting the analytical framework used to interpret the correlation co-efficient |
As opportunities arise, we might link in more of the analysis we have performed for the Generator Report Card into articles here on WattClarity…
Q3) Who’s the audience for the Generator Report Card?
Because of what we do, our client base is naturally broad (much broader than just those directly involved in the wholesale market, for instance).
It was our intention (and it has turned out to be) that the Generator Report Card would also be similarly broad in its applicability:

Those who have already come onboard provide some validation of our sense that would be of high value to a wide range of stakeholders in the NEM, and the NEM transition:
| Government Departments and Market Bodies |
Direct NEM Participants | Indirect NEM Stakeholders |
| All the NEM-focused departments of Energy have purchased their own access to the Generator Report Card (across Canberra, Adelaide, Hobart, Melbourne, Sydney and Brisbane).
Most of the Market Bodies also have access to the Generator Report Card. |
A growing number wholesale market participants have purchased access to the Generator Report Card – be they registered as: 1) Generators; 2) Retailers; or 3) Large Energy Users.Some of these market participants are newer entrants to the NEM (in which case the insights we share about the Semi-Scheduled category, and battery storage, will be particularly relevant). Others are older hands in the market (each of whom will gain differing value depending on their own particular operations in the NEM). |
Beyond these direct wholesale market participant, a broad (and still growing) number of other stakeholders are enjoying access to the Report Card.
These include: |
| If you work in one of the organisations above and were unaware that you already have access, simply download your copy of the Report Card here – remembering to register an account using your work email address. | ||
If you have specific questions about how the Generator Report Card might be of use to you, please call us +61 7 3368 4064) or tell us more of your question here.
Q4) How did we prepare the Generator Report Card?
In the process of completing this process, we came to the clear (and much deeper than had been the case previously realisation that the AEMO’s MMS is designed for operational purposes and is far from fit-for-purpose for completing the type of analytical assignment we took one in starting the Generator Report Card process.

We knew of a number of these before, but we became aware of so many more shortcomings as we built a specific analytics-friendly post-process database we conveniently labelled “Beast”.
Part of our challenge, moving forwards, relates to several aspects of making this data store accessible to our clients in various ways, and at various different levels.
Q5) How to access the Generator Report Card?
Last but not least, one of the most Frequently Asked Questions has all been to do with how people can access their copies of the Generator Report Card:

Depending on whether your organisation already has access set up (or not) this is how you can access:
| This is how to Access your Copy … for those who have already ordered |
This is how to Place your Order … if you have not yet done so |
| Clients should have their access to the electronic copy Generator Report Card here:
Generator Report Card You’ll need to set up your own unique log-in, using your organisational email address in order to access:
One bound hard-copy is also being supplied as well (if we have your best postal address).
|
It’s a simple matter of completing the Order Form and sending back to us:
the Order Form … and send back to us. We’d then: |
———-
… and so (with the above background completed) it will be on with the show this evening…

For those who can’t make it, there’s another opportunity back in Sydney next Wednesday 21st August, where there may still be tickets available…
Leave a comment