Late on Friday afternoon last week there was a significant AUFLS (automated under-frequency load shedding) event in the electricity grid of Great Britain. This sparked much discussion, online and offline, over the weekend between various groups of data junkies (myself included), and led to this somewhat-related article here on WattClarity also today.
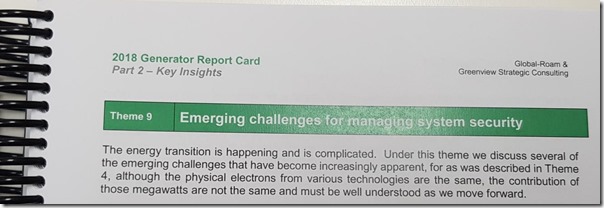
Given these discussions, I thought it would be handy to publish openly here some of what we included within Theme 9 within Part 2 of the Generator Report Card for the Australian grid – as there do appear (at least on initial review) to be some significant similarities:
As illustrated, in Theme 9 we explored a number of different aspects of “Emerging challenges for managing system security” in Australia’s National Electricity Market (NEM), and the grid underneath that makes this market (or any form of dispatch) possible.
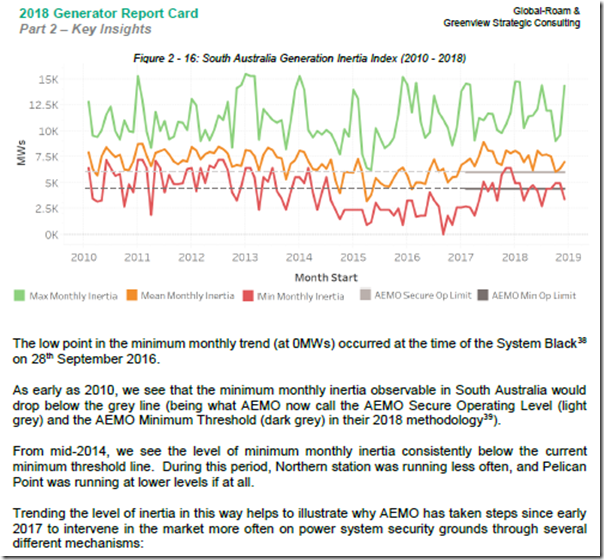
Amongst the different aspects we explored within this theme, we reverse-engineered the instantaneous provision of inertia in the grid “naturally” provided by synchronous generation in each of the regions of the NEM. In the following chart and discussion, lifted from the Generator Report Card (p33 of part 2 for those who have their copy) we show the MAX/AVE/MIN range apparent each month for the South Australian region:
Note for those who have more of a real life than us data junkies – inertia is commonly calculated in “megawatt seconds” (i.e. MWs). Also, those who are a little rusty might appreciate Jonathon Dyson’s handy explainer of why system frequency is so important, and also Allan O’Neil’s prior case study of what happens when a generator trips.
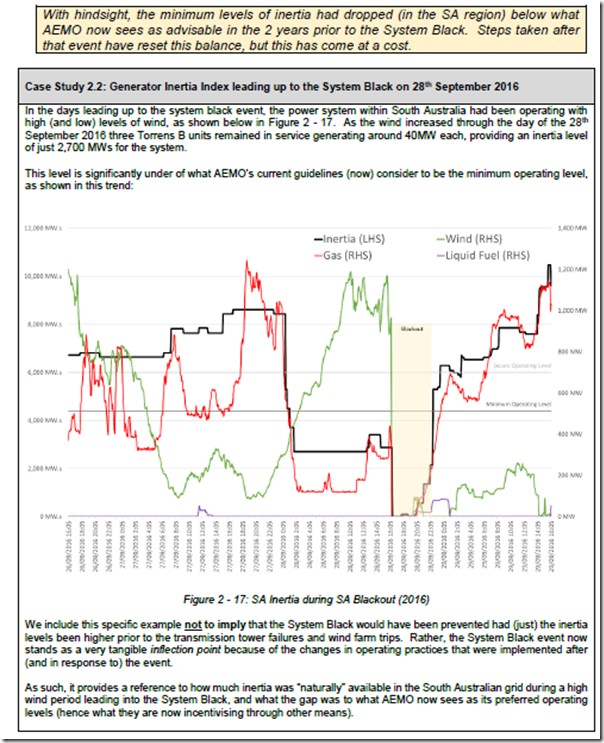
For illustrative purposes in the Report Card (and because it continues to be just so topical) we “zoomed in” to trend our calculation of the instantaneous level of inertia supplied by synchronous generation plant at the time of the SA System Black on 28th September 2016:
Apologies for feeling the need to be pedantic (triggered in part because of these two very vocal and far-too-influential groups ) but I re-iterate last week’s caution that this article is posted, and the details explored within the Generator Report Card, to in no way attribute “blame” for the events leading into the SA System Black.
It may well prove that there were similar contributing factors just experienced in the UK – though one would need to delve into the high-speed sub-second data from measurement points across the grid to really discern this. We’re sure that National Grid in the UK will be starting to do this for their report to Ofgem.
——————————–
For those who wish to discuss this further, or more generally explore the insights shared in the Generator Report Card, these events in Sydney on Wednesday this week and Wednesday next week would be a good opportunity (or just let us know via this feedback form).
… and finally:
1) Those who already have access can download the Report Card here; and
2) Those who do not access can arrange this by returning the Order Form to us.


Please explain what is wrong with my understanding of inertia
In practice inertia is a store of energy. If a generator goes offline then the energy stored in the other rotary machines on the grid, (motors as well as generators)as well as the energy in the windings of motors generators,transformers and the transmission links (inductance) forms the inertia of the grid. Referring only to the mechanical or rotary inertia it is Jw^2/2 which J is the polar moment of the machine w is the angular velocity.
Now because the frequency is only allowed to fall to about 48 Hz before disconnection, the useful inertia of a turbo generator is J x 2 xpi x (1-(48/50))^2. or roughly 4% of the system inertia. So if there is 4,200 MWs in the system then only 168 MWs can be used before cascading failure begins. Assuming a rate of change frequency ROCF of 0.5 Hz/s that is 168 MWs delivered over 4 seconds (2 Hz/0.5).i.e. 42 MW.
If a battery can deliver 42 MW for 4 seconds that effectively provides the same energy as all the available system inertia so one can argue that the Hornsdale battery actually provides 129 x 3600 = 464,000 MWs far more than the available rotary inertia in the system. Even with a ROCF of 1 Hz/s inertia only supplies energy at less than 100 MW and only for 2-3 seconds. After that if governor response has not kicked in, goodnight folks.
Similarly, synthetic inertia can be provided by wind and solar farms via slightly different mechanisms.
a) A typical modern wind turbine has an Inertia constant of 4-5. i.e. a 4 MW wind turbine with an inertia constant of 4 has 16-20 MWs of inertia, but because most wind turbines are asynchronous machines, their speed can be allowed to drop by 10-15% while the power converter still puts out a constant frequency. So if you allow the rotary speed of the turbine to fall 15% then the available inertia per MW is 1 x(1-(42.5/50)^2) = 0.38 MWs/MW. so 1,000 MW of wind turbines can contribute about 380 MWs whereas 1,000 MW of gas turbines with a typical inertia constant of 3 can only contribute about 3 x 1,000 x 0.04 = 120 MWs
b) a solar farm can similarly provide synthetic inertia by running slightly below peak instantaneous capacity. If 1,000 MWs of solar farms are running at a nominal 800 MW but deliver only 760 MW, it can ramp up output almost instantly to 800 MW thus providing 160 MWs over 4 seconds just as the gas plants would.
Thus a properly engineered wind/solar/storage system can provide much faster disturbance response with lower inertia. In fact because the inverters don’t have inertia they can respond to deviations much more quickly.
There is a whole other discussion about what happens next but that is for another time