Firstly, my apologies for those who tried to wade through my imprecise verbal explanation (in Thursday’s RenewEconomy podcast) of the analysis we’d done of generator ‘dependability’ as one part within the mammoth Generator Report Card – I note that Giles called it a “compendium” and David called it a “weighty tome”. Add that to the list of adjectives, but the best feedback for me is that those who have bought and read a copy have been very positive about the effort. Makes the 1,000s of hours invested worthwhile.
However, back to the podcast – where it seems that I have a ‘voice for mime’, along with a ‘head for radio’. Perhaps I just stick to the written word on WattClarity for now! Because I was not as clear as I would have liked to have been, I thought I owed it to those listeners who took the time to listen to explain (in clearer written English) what we’d done – particularly with respect to the availability of coal units.
———————–
Amongst the 530 pages that the Generator Report Card encompasses, we included:
(1) 6 pages under Theme 8 in Part 2 where we discuss some aspects of how “Thermal plant is ageing, and this brings concerns”; along with
(2) Another 38 pages in Part 4 about a range of different data on coal-fired power that now operates across 3 regions of the NEM (down from 4 with the closure of Northern in South Australia in 2016).
That’s a few pages (not counting the individual pages for every DUID – i.e. fancy AEMO term for dispatchable unit, for those who asked before – in Part 3), but the reason why such a focus is given is that (as ABC journalist Stephen Letts quotes here) 75% of the “grid energy” supplied by the NEM is still supplied by coal-fired power stations, of which there are 48 units still operational (10 brown coal in Victoria, and the rest black coal in NSW and QLD). Hence they are critical to supplies – and effecting an energy transition that works must incorporate proper, rational (and not so emotive) consideration of what’s actually happening with these coal power stations.
(A) Assessing different facets of ‘dependability’
Hence we took at detailed look, which I tried (unsuccessfully?) to explain in the podcast.
Key to this was a consideration of these different aspects of the ‘dependability’ of coal-fired power:
1) In the podcast, I just tried to explain what we’d done with Availability –
2) Whilst David also mentioned one of the three different methods we used to look at “Sudden Failure” (chart already included in this post).
… it’s important for readers to understand that these two measures are somewhat related, but also separate as well, and that all 5 have their own value in the understanding of broader ‘dependability’ (and, as we note in the report, these 5 are not the only ones that are important).
(B) One facet is Availability
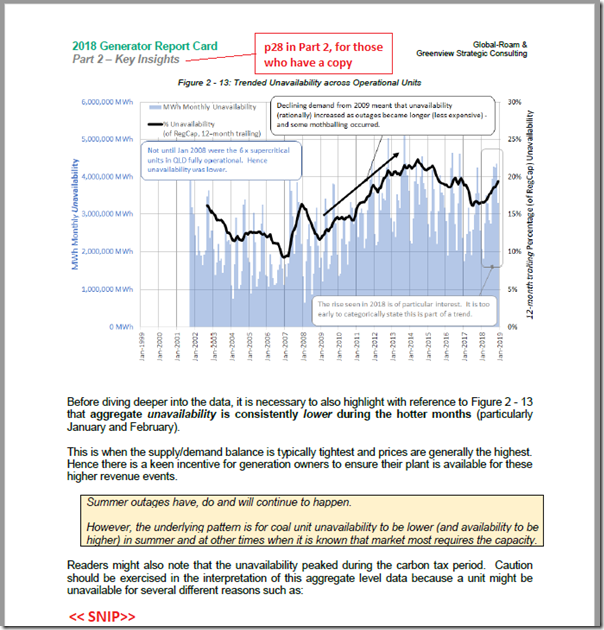
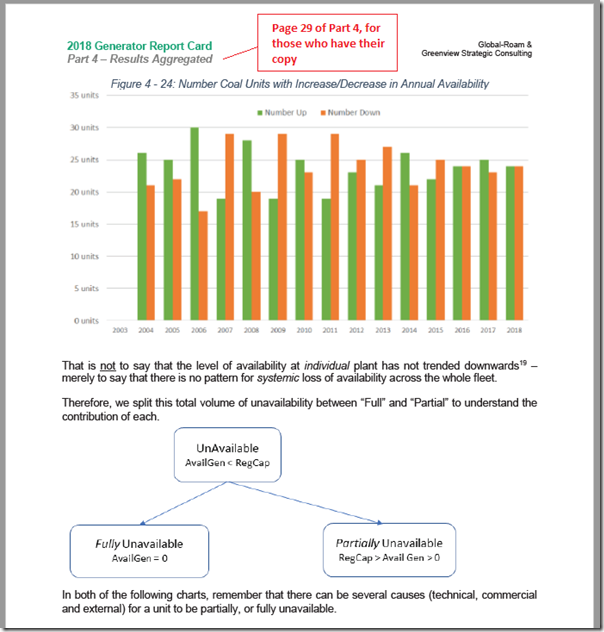
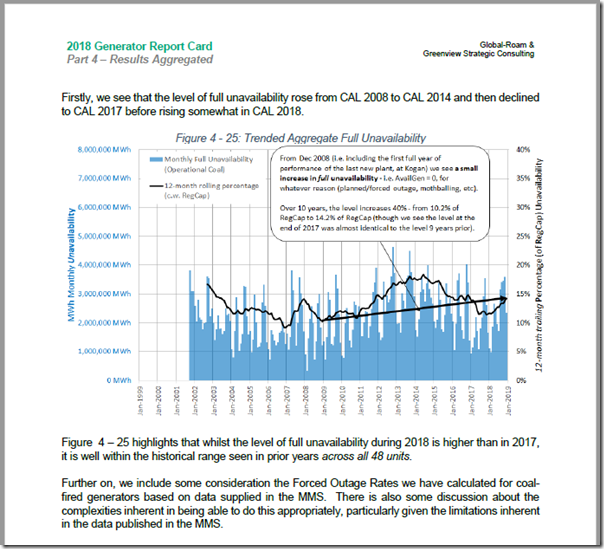
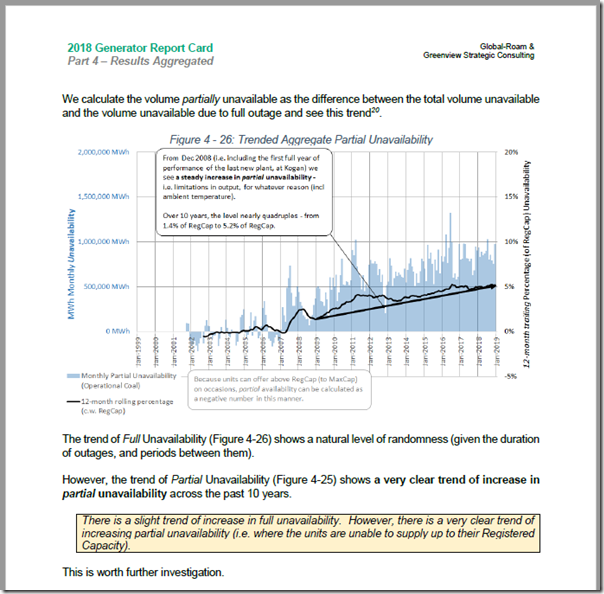
In the podcast, I tried (unsuccessfully?) to explain what we had done in analysing the level of availability (or, more specifically, the unavailability as a monthly volumetric measure) of the 48 x operational coal-fired plant across 20 years of history, noting that 6 of the units in QLD (super-critical units – with HELE seeming to be the latest buzzword descriptor, and a very vague one at that) were only fully commissioned at the end of 2007. I spoke about 3 charts we produced, so I thought it would be clearest if I included them here, along with the relevant accompanying text from within Part 2 and Part 4 of the Report Card.
This excerpt came from the summary in Part 2, showing unavailability as a volumetric measure:
We then broke this down into two broad categories “fully unavailable” (i.e. unit offline) and “partially unavailable” (i.e. unit availability lower than registered capacity), as follows – and then further sub-categories (not shown here):
We then looked first at full unavailability, and noted that the 17-year trailing annual aggregate trend (because availability was not published by the AEMO in the first couple years) was quite flat, allowing for variation in the timing of major outages for these units and periods of over supply and under supply.
However taking a look at partial unavailability, we saw a fairly consistent trend of increase:
As noted, this is worth further investigation – however we do not know of any other analysis (at least in the public domain) that has been completed to this level of detail, or which has taken it further. If readers do know, we would be grateful if you could note this below?
——————————–
Don’t forget that you can order your copy here today (to receive your own hard-copy, and an electronic PDF for your organisation’s internal use).


Leave a comment