An alert reader alerted us to the possibility of the demand in South Australia dropping to an all-time minimum level through the afternoon of Sunday 21st October 2018.
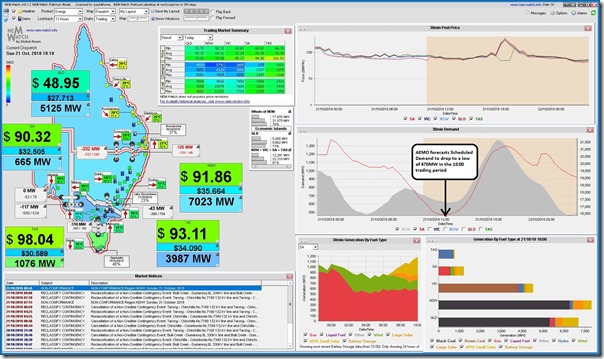
Here’s a snapshot of NEM-Watch v10 that I’ve taken to highlight how low the demand currently is (Scheduled Demand at 665MW in the 10:10 dispatch interval) and how it is forecast to drop quite low (current forecast for 470MW in the 13:00 trading period):
Now with this forecast of record all-time minimum, we should note three things:
Note #1) In this case we are going to use “Scheduled Demand” on a dispatch target basis as the gauge of electricity demand in the South Australian region – with many of the nuances/permutations of measuring/calculating “electricity demand” explained in this earlier WattClarity post.
Note #2) Using this measure, electricity supplies from various embedded generation sources (most notably rooftop PV) subtract off the actual rate of electricity consumption to drive Scheduled Demand lower.
Note #3) Calling this an “all-time* record minimum” means that we’re excluding the effect of the SA blackout of September 2016, where Scheduled Demand fell to almost 0MW.
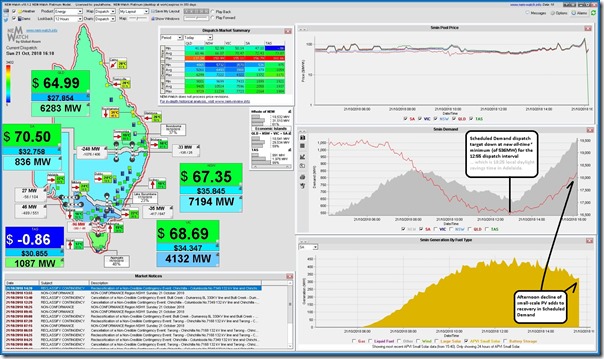
As it turned out, the lowest the Scheduled Demand reached today (at least later in the afternoon, when this short article was posted) was down at 536MW at 12:55 early this afternoon. We see that (at the time of the 16:10 NEMwatch snapshot) injections of small-scale solar PV were declining through the afternoon, which would be one of the contributions to the climbing Scheduled Demand:
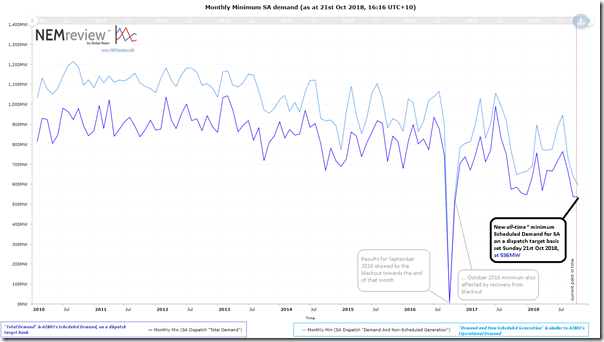
Logging into NEMreview v7 online, I quickly ran a query for monthly minimum demand to confirm the suspicion that today we’d seen something down at the bottom of the historical range (apart from the blackout):
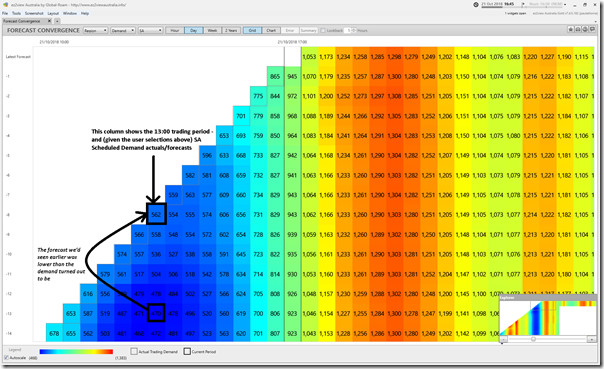
Finally, curiosity getting the better of me before posting this article, I had a quick look at successive AEMO forecasts for Scheduled Demand through the afternoon through the “Forecast Convergence” widget in ez2view.
The snapshot below highlights how (on a trading period basis) the earlier forecast down at 470MW for the 13:00 trading period ended up being 562MW (or 92MW higher – which is not much in absolute terms, but is a 20% increase on the forecast seen in the forecast shown in the 10:10 NEMwatch snapshot above):
We’re looking forward to working with the relevant people within AEMO to make this particular functionality better than it already is, for the benefit of all of our ez2view clients.


Wind output was quite low at the same time, so SA exports may not have tested the limits there, but AEMO stability requirements will still require some synchronous generation at the SA end (to mitigate risk during unplanned interconnector trip).
The AEMO Q2 dynamics report showed some significant curtailment of semi-scheduled (wind) generation, so it would be interesting what the system would look like during a scenario of the same low demand but high wind.