In my post last week, I noted that “our need to rapidly increase the capacity of our thinking, to deal with a greatly increased number of wildly changing variables, currently seems to have far outstripped our collective willingness, or ability, to do this (or, in most cases, even an awareness that this intelligence gap has opened)”.
This followed from an earlier comment the week before, and that was also not the first time I’ve made that point on WattClarity…
(A) Three examples come to mind this week…
I’ll list the three (all somewhat related) but focus on addressing the first one directly in this post:
(A1) Why are spot prices high in Queensland?
This week there’s been another round of finger-pointing over high wholesale electricity prices in Queensland – dutifully covered in places like the Australian and the ABC. Sad to say that this kind of thing has become almost expected from people I’d hope would be our wiser leaders.
I did a double-take, however, when I read this line in the report from the ABC:
Tony Wood, energy program director at the Grattan Institute, said there was no clear explanation for why Queensland has seen high electricity prices in recent years.
(my emphasis added)
Part of the reason for my reaction, I think, is that I respect Tony and the work done by the Grattan Institute. It made me wonder how many others are still in the dark about the factors causing Queensland prices to be high.
In the interests of clarity, let me post what I hope is a clear explanation below. Please feel free to weigh in with comments (online below, or direct with me) to let me know which quadrant you think my explanation falls into:
(A2) If prices have risen significantly in QLD (where we don’t have wind) then wind can’t have contributed to price rises in SA, can it?!
The South Australian government has been on the receiving end of a fair amount of criticism over the past 12 months, following from a number of events (including the blackout of 28th September, the load-shedding of 8th February and a near-miss of 3rd March that’s less talked about), with security of supply concerns layered on top of concerns about rising electricity costs. A number of critics have taken the over-simplistic view that the outcomes in South Australia have been wholly the result of the rise in market share of intermittent generation.
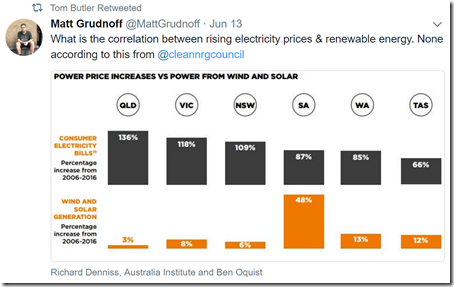
More broadly, the renewables industry has felt the brunt of these criticisms, and has understandably responded. The following chart (from the CEC) is one that has been doing the rounds for a number of months:
(a) Those towards the “rabid right” of the Emotion-o-meter should not read this inclusion as me stating that the CEC is totally wrong in drawing attention to the over-simplification that “renewables are to blame for everything”.
(b) However those towards the “loopy left” of of that same Emotion-o-meter should also not read this chart as “proving” that the complex nuances of intermittency have had nothing to do with the growing challenges faced in South Australia – and which we will increasingly face more broadly NEM-wide.
Again, my main point is that I am hopeful that all of us (including, but not just the CEC) can rapidly progress our up the learning curve such that we can more fully understand the increasingly complex electricity system, and clearly communicate some of these complexities to others.
(A3) “The other guy” is always to blame for the bad stuff
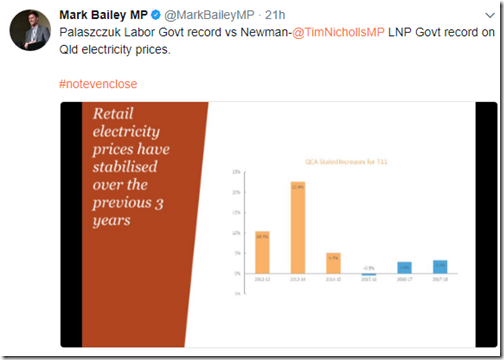
Back squarely in the political domain, there’s been far too many examples (and not just in energy policy) where “the other guy/gal” is always to blame for the bad news (e.g. high prices), whilst the current Government/Minister is always the person to take credit for the good news. Given the theme is Queensland in this post, I’ll pick on the QLD Energy Minister (though they all share similar traits – though perhaps some not as prolific on Twitter):
My point here not that what has been noted is completely wrong – though it would have been truer if Mark had also noted:
(a) That there are lagging factors from yesterday contributing to what we see in retail prices today. Hence it’s a bit simplistic to just say increases in the other guy’s term were wholly there fault (and not contributed to them, to some degree, by decisions made in the Beattie/Bligh period); and
(b) It would also have helped if Mark had clarified that percentage increases during his term are off the higher base achieved by the big percentage increases beforehand.
etc…
Again, my point is that I don’t believe I’m alone in wishing that our elected leaders would start to act more genuinely like the real (i.e. wise) leaders?
Each of the above examples relate to high spot prices in the QLD region of the NEM in various ways.
Each of these cases also provides what I see as a pretty stark illustration of why we need to (collectively) raise our level of thinking about the significant challenges that confront us in this multi-faceted energy transition. Within our own company, we are really striving to do this – which is why we have re-invested $millions over the years in continuing to make our software provide an increasingly better picture, for instance.
(B) Three main reasons why spot prices in Queensland have risen
There are more than three reasons, and I don’t have time to go into them all – but the following three are (in my view) the most significant.
Frequent readers at WattClarity will remember that we’ve been posting analysis of high prices in Queensland – indeed, we even published quite a lengthy report going into some detail of why prices rose in summer 2012-13 (back at the time clients paid $5,000 for this report – but the passage of time has enabled us to drop the price to only $500, despite the fact that some of the same factors are still relevant).
(B1) Market Structure has consolidated
Back when the NEM started, there were four (smaller) Government-Owned Generation Companies operating in Queensland – CS Energy, Enertrade, Tarong Energy and Stanwell Corporation. Since then, these four companies have been whittled down to only 2 – larger CS Energy and larger Stanwell Corporation.
(a) Enertrade (an organisation set up to trade loss-making power purchase agreements entered into by the Government prior to the NEM), was wound up in 2007, and the PPAs reassigned to the three remaining GOCs.
(b) On 1st July 2011 three became two, with the reallocation of the portfolio between just CS Energy and Stanwell Corporation
The move to two GOCs was initiated because of what the Bligh Labor Government at the time saw was a poor financial return from the three generation companies that existed at the time. As shareholders, they sought to improve the returns on their investment in these assets, so the corporations could contribute more to the Queensland budget in net terms. There’s other reports about the money that Queensland Treasury had to chip in to keep some operational.
Hence the response is an understandable action for a shareholder (whether Government or private) that owns multiple organisations competing in the same market. Unfortunately it has contributed, in no small way, to the higher prices we’ve been seeing for a number of years.
A key point here, in the debate this week and in prior years, is that the core underlying reason is market structure (i.e. concentration) as distinct from market rules. It is important to understand that the GOCs have (as much as I have been able to see, being an outside observer) operated as they should in a competitive market – by striving to deliver the best returns for their shareholders. A reduced number of competitors (especially after 2011) allowed a much greater range of flexibility to make this happen.
(B2) Queensland region demand has increased
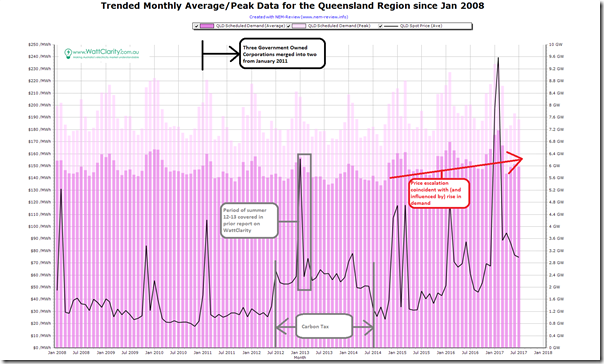
Coming on top of the greater market consolidation in Queensland, electricity demand in Queensland has increased in more recent times – which is an outcome different than the declining demand story seem more generally. This has been predominantly due to the upstream (electrified) compression of coal-seam gas being piped to Gladstone to export through three shiny new LNG export terminals.
This can be seen in the following chart of monthly average (and peak) “Scheduled Demand” produced in NEM-Review v6:
For ease of reference, I have also marked where the 3-into-2 merger occurred – changes flowing from which were apparent in summer 2012-13 and have continued since.
The growth in domestic demand over the past 18 months or so has been compounded by a flow-on effect of generation closures in the south (dragging more production from Queensland south over the QNI interconnector).
(B3) Gas for generation has greatly increased in price
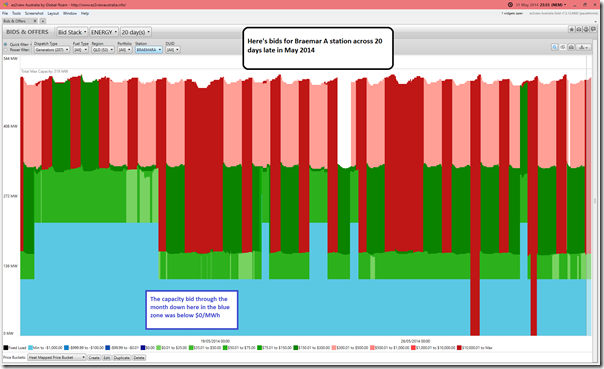
In the years leading up to the commissioning of the LNG trains, upstream coal seam gas wells were drilled and, because of their nature, could not be easily capped – hence the gas supplies were sold under low priced arrangements commonly called “take or pay”.
As the LNG trains have been progressively commissioned, the pricing of gas for power generation has changed markedly – which has flowed through to bid prices for gas-fired plant in Queensland.
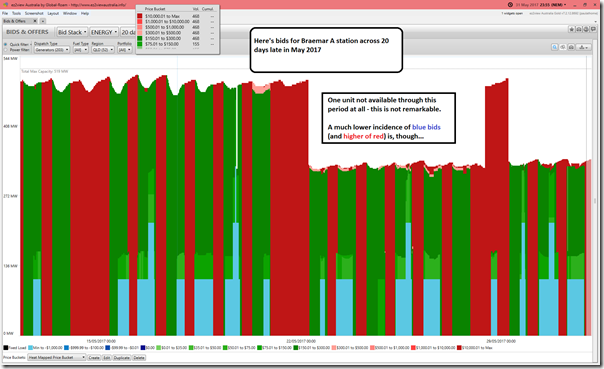
Using ez2view and randomly sampling bids for a randomly selected gas power station (Braemar A power station – operated by a private sector player) in the following two images illustrates this point – see the much lower incidence of blue bids (i.e. bids below $0/MWh at the RRN) and much higher incidence of red bids (i.e. bids to run only when the price is above above $300/MWh):
I hope that this post has done a bit to make these three key changes underlying the higher spot prices for QLD more clear?


But the bigger picture is gas prices have risen due to Green enforced demand policies globally and lack of coal supply locally.
As for correlating price rises with renewables installed the previous point is also relevant in that we have a national grid so a spike in renewables in SA simply lifts all boats with backup expensive gas generation, while SA grabs the localised benefit of the cheap marginal wind production. Basically beggar they neighbour policy which we can’t tell from the simplistic graph. Needs work.
There is an interesting correlation between gas prices and electricity prices in SA available at http://www.theage.com.au/federal-politics/political-news/hugh-saddler-its-gas-not-renewables-that-is-pushing-up-electricity-prices-20170712-gx9vvm.html which provides an answer. While it is expected that gas sets electricity prices in SA (‘cos there is only gas fired generation there), gas is the source of marginal generation in most other regions and so sets the price
Thanks David
Just remember that “correlation is not necessarily causation”.
Peter Martin’s later piece is here:
http://www.theage.com.au/comment/it-not-the-wind-its-the-gas-why-power-prices-are-going-berserk-20170712-gx9lxe.html
In this he comments:
“Wholesale prices and those charged to businesses that buy directly are up an extraordinary 60 to 70 per cent. It’s renewables that are doing it, along with the closure of Victoria’s giant Hazelwood coal-fired power generator, according to Tony Abbott.
The truth is simpler, and speaks volumes about the appalling way we’ve handled energy planning.”
Unfortunately this is a case where there are other factors at work, in addition to just the high gas prices (including both the Hazelwood closure and the intermittency).
It’s not more simple than Tony Abbott’s (incorrect) portrayal – it’s more complex.
Paul