
Gigabytes of bandwidth and acres of digital newsprint may well be devoted to arguing the ultimate reasons behind yet another blackout – albeit only partial – in South Australia yesterday evening:
In this analysis I’ll stick to the immediate causes apparent so far in the market data.
Whilst prices did of course spike to $13,000-$14,000/MWh for over 2 hours, including the duration of the load shedding (when the spot price is automatically set to the Market Price Cap), this post will focus on the supply / demand balance we saw yesterday. This, rather than bidding behaviour or other factors, was the key driver of both the load shedding and the extreme prices.
I’ll start with an analysis of the demand and supply situation around the time of the load shedding, then some observations on how the day evolved.
Extreme heat drove SA demand to very high levels
Adelaide endured a maximum temperature of over 42 degrees and some inland locations saw readings exceeding 46 degrees. This pushed scheduled demand well above this summer’s previous highs, approaching 3,100 MW, seen here along with dispatch price and (local) generation availability over the period 12:00pm – 10:00pm AEST in this screenshot from ez2view’s Time Series Data Viewer tool:
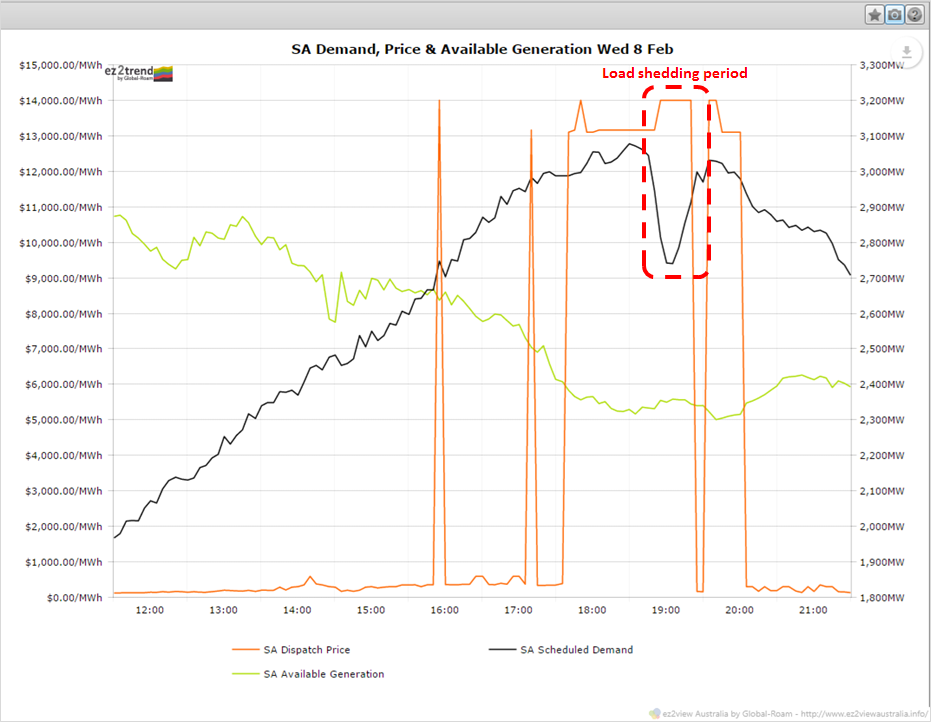
This demand level corresponds to AEMO’s “P10” maximum half hourly demand forecast for South Australia in the most recent National Electricity Forecasting Report – meaning a forecast expected to be exceeded only one year in ten.
Demand last exceeded this level in January 2014 (and reached levels over 3,300 MW in 2009 and 2011), however AEMO’s forecasts have predicted declining maximum demands due to assumptions of increasing PV penetration, energy efficiency, and changes in South Australia’s economy.
An observation from this chart is that it shows a demand drop of about 300 MW during the load shedding period compared to the 100 MW figure quoted in AEMO’s media release – the reasons for the difference are unclear.
South Australian Supply
The green line on the chart above shows available generation in South Australia on Wednesday afternoon / evening. Three features are immediately obvious:
- The line moves around substantially (isn’t generation capacity more or less fixed?);
- It declines through the afternoon peak whilst demand is climbing (why?); and
- There is a large gap between local generation capacity and demand throughout the afternoon peak (what fills this gap?)
The answer to the first two questions is that “available generation” reflects maximum output that can be physically produced given real time wind and temperature conditions. With a large fleet of wind generators in South Australia, falling wind speeds on a hot, still summer afternoon meant less maximum output from those windfarms. To a lesser extent, very high temperatures also degrade the maximum output capability of most forms of generation, particularly gas turbines, and a smaller part of the decline is due to this effect.
The gap between local supply and demand is met from the two interconnectors linking SA to Victoria and the rest of the NEM – the Heywood AC interconnection capable of securely flowing around 600 MW into SA, and the Murraylink DC interconnector, which has nominal capacity of 220 MW.
The following chart breaks down the contributions of thermal generation (gas and liquid fuel fired), interconnector imports, and windfarms to South Australian supply yesterday:
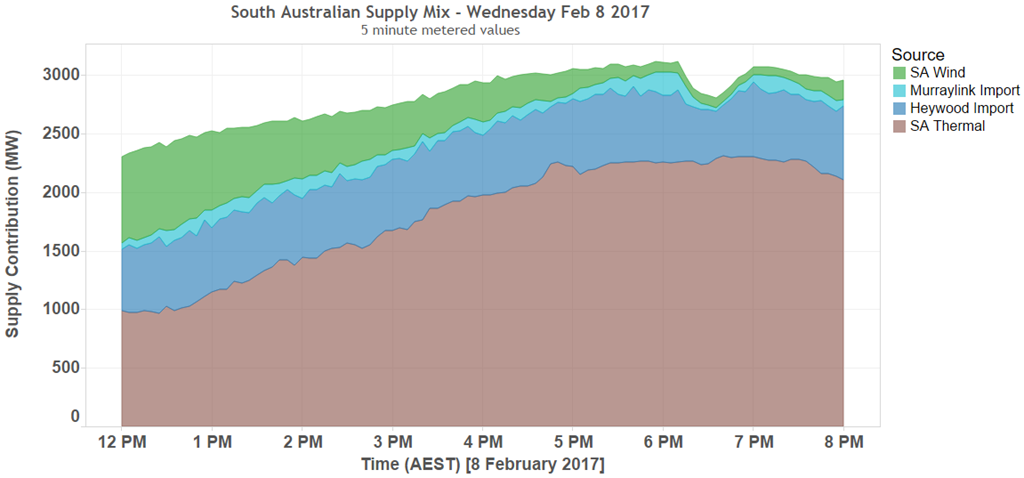
This highlights the output from wind generation falling away into the afternoon and the increasing contribution from local thermal generation. Combined interconnector imports were relatively constant through the afternoon.
So why the load shedding?
The quick answer is that by 6pm AEST (6:30pm Adelaide daylight saving time), all online, available local generation sources in South Australia, wind and thermal, were producing their maximum available output for the conditions. More interconnector imports were needed to fill the increasing demand-to-generation gap shown in the earlier chart, and – on the Murraylink interconnector – had exceeded levels consistent with keeping the power system in a secure state. We can see this in the following snapshot from ez2view showing the South Australian region for dispatch interval 18:05 (the five minute period 18:00 – 18:05).
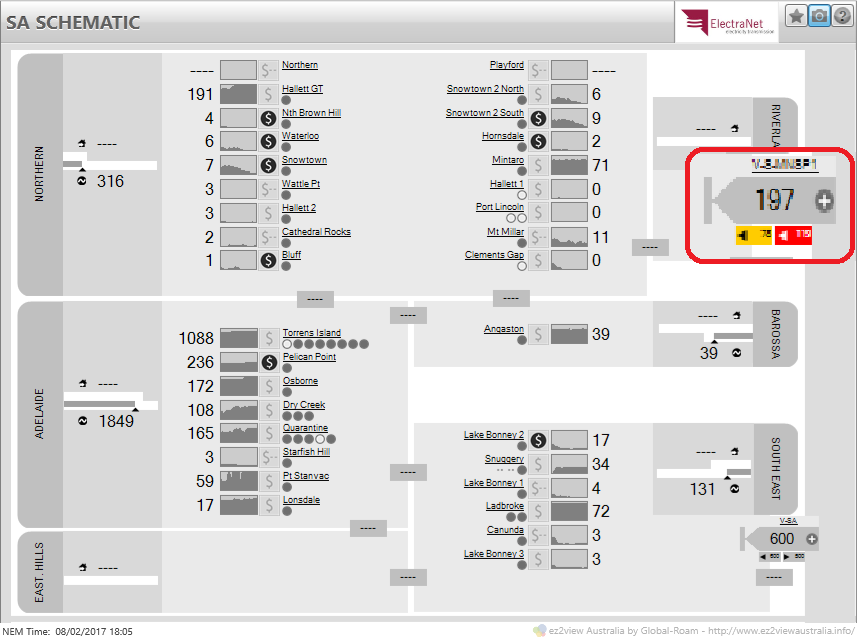
I’ve enlarged the icon showing target flows (197 MW) on Murraylink and, in the very small font underneath, limits on these flows – the relevant one is the left hand import limit of 78 MW, which is being exceeded by over 100 MW. In fact this situation of Murraylink flows exceeding limits had pertained for about 30 minutes preceding this snapshot.
These limits do not reflect the physical interconnector capacity (220 MW) but are the output of system constraints designed to keep the power system in a secure operating state. Outside the bounds of these constraints, a single contingency such as a line or generator trip, could possibly result in damage to equipment, risks to safety, and in the worst case a widespread blackout. Broadly, AEMO has an obligation to return the power system to a secure operating state within 30 minutes.
The only reason flows on the Murraylink interconnector would have exceeded the relevant import limit in the first place is that no further generation supply was available for dispatch in South Australia at this time – AEMO’s dispatch process will fully utilise all available generation resources before scheduling such constraint violations.
With demand continuing to rise, no further local generation able to be dispatched, and interconnector flows beyond secure levels, AEMO instructed SA Power Networks – the local distributor for South Australia – to begin rolling load shedding.
Generation Analysis – Why did supply fall short?
I’ve prepared the following table comparing actual generator outputs at 6pm AEST yesterday – a fair reflection of their maximum capability at the time of load shedding – with the nominal summer capacities of each power station in South Australia, broken into Thermal and Wind groups, as well as nominal interconnector capacities (but note the comments above on the impact of constraints):
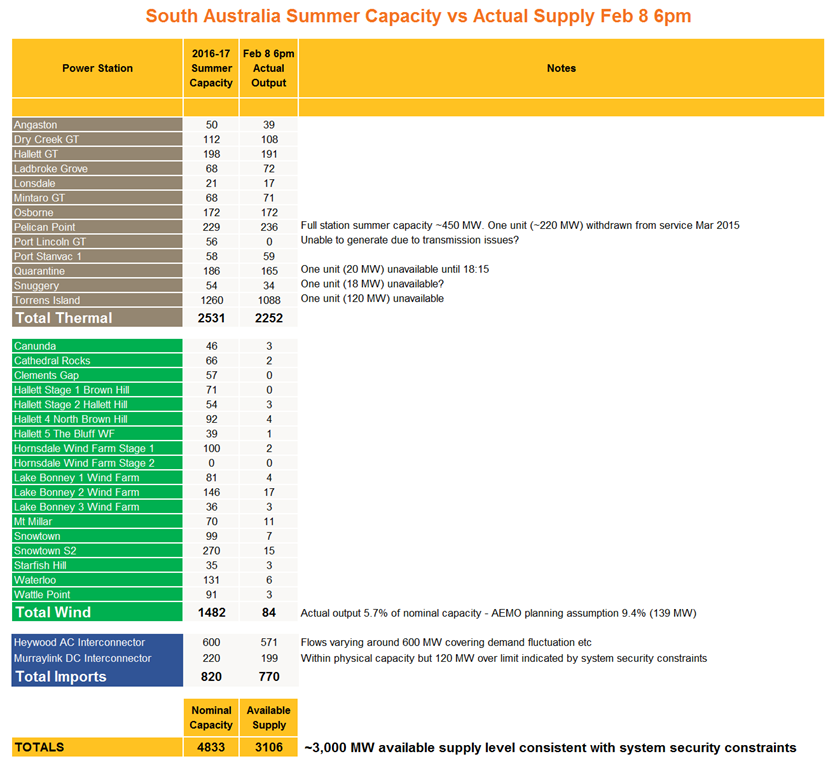
Notes to the table indicate where specific thermal stations had output materially below capacity due to unit outages.
Thermal stations as a group produced to about 89% of their nominal summer capacity. The largest outages being one unit (120 MW) at Torrens Island Power Station and the Port Lincoln Gas Turbines (56MW) being offline, the latter reportedly due to transmission issues.
The other, long term, outage noted above – and not counted towards nominal capacity for yesterday – is the withdrawal of one unit at the Pelican Point gas fired power station from regular service since March 2015. This unit is not available for immediate dispatch – according to this AEMO document:
“ENGIE has advised that half of the Pelican Point Power Station capacity (239 MW) can be assumed to remain out of service …, and that the full power station capacity could be made available within three months, subject to the commercial viability of returning the unit to service”
Update Thurs 9 Feb:
This afternoon we have seen AEMO issue a Direction to a South Australian market participant following declaration of a Lack of Reserve 2 (LOR2) event, and from 15:55 AEST generation at Pelican Point ramping up to around 320 MW, which would be consistent with startup of the “withdrawn” unit. Furthermore comments attributed to AEMO in this media article imply that with early enough notice on the day, startup of this unit might have been achievable on Wednesday – contrary to the statement above.
As an inherently variable supply source, the nominal capacity of wind generation is less relevant than the proportion of that capacity that can be “conservatively” assumed to be available at times of peak demand. AEMO use an assumption of 9.4% in their system reliability studies, and at 5.7% yesterday, wind output was about 55MW lower than this level.
As noted earlier, flows on the Murraylink interconnector were within physical capacity, but in excess of constraint limits.
Overall, this analysis indicates overall available supply capable of supporting demands up to about 3,000 MW under the conditions ruling yesterday. Hence as demand approached the 3,100 MW level, AEMO ordered planned load shedding to reduce demand and thus maintain secure system operation.
What could be seen earlier in the day?
Yesterday’s events caught many by surprise (certainly this observer, exhibit A being I produced a quick post mid-afternoon on Wednesday focussing on the outlook for Thursday 9 Feb and ignoring the outlook for the rest of Wednesday afternoon). Those events were a very unpleasant surprise for South Australians left without power during the peak of the late afternoon heat.
Full discussion of “who should have done what, when?” is not appropriate for this early post, I’ll just use the extent of the demand surprise lurking in AEMO’s on-the-day predispatch forecasts to illustrate the difficulties in predicting even the short term future of the market.
This chart, based on ez2view’s Forecast Convergence tool shows how AEMO’s predispatch forecasts evolved through the day – to partly reduce clutter not all these forecasts, which are updated half hourly, are shown:
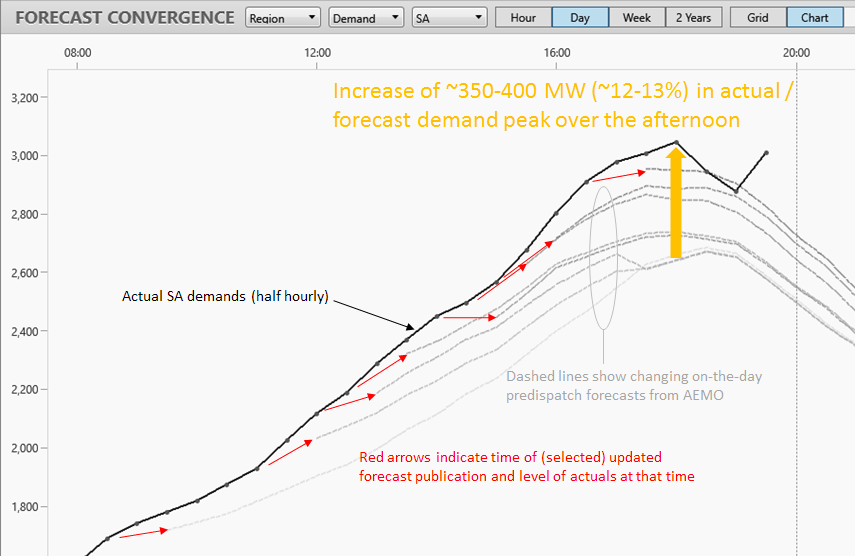
Actual demands continued to climb well above successive predispatch forecasts, which never came close to keeping up. Even the forecasts produced relatively late in the afternoon did not show demand approaching the 3,000 MW level discussed above.
For a second, numerical view of this data, we can use the Forecast Convergence tool’s “Grid” view:
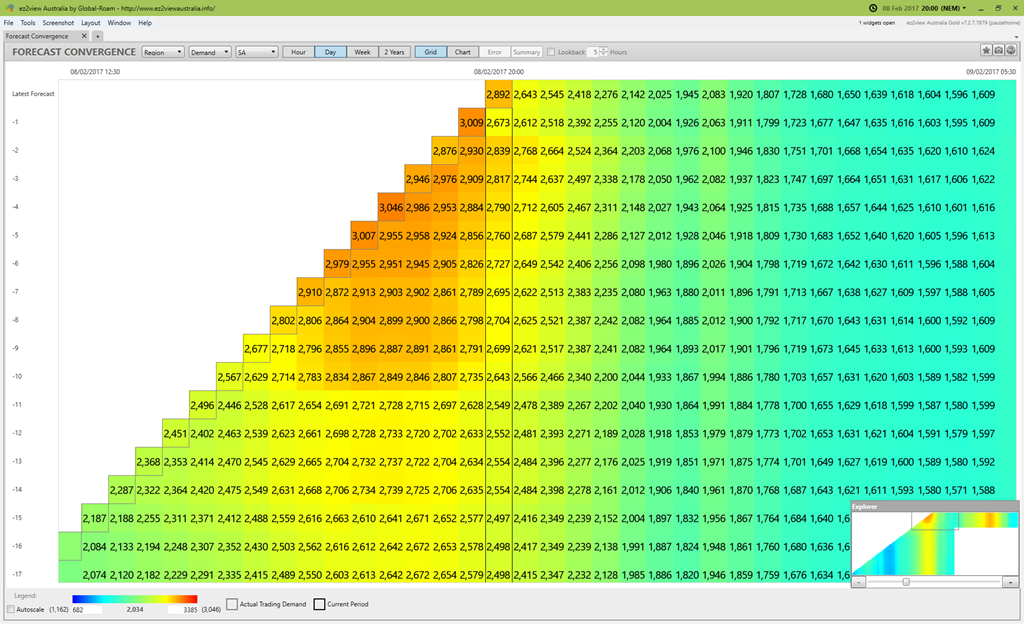
Each column on this is for a specific half hour of the day. Each row represents a forecast of half hourly demands out for the balance of the day (latest forecast at the top), with actual values showing on the diagonal. Reading the chart up each column shows how the forecasts for that half hour evolved over the day.
Summary and Conclusions
- South Australia effectively “ran out” of secure power supplies due to extreme heat pushing demand to levels beyond that supportable, given wind and system conditions on the day
- Rolling controlled load shedding over a period of ~1 hour was used as the last option to keep system supply and demand balanced in a secure operating state
- The performance of those generators available on the day, including windfarms, and interconnections, was probably generally consistent with pre-summer planning assumptions
- Even on-the-day forecasts struggled to envisage the size of the demand peak ultimately reached, However, given the limitations on supply available at the time, more accurate on the day forecasts may not have changed the ultimate outcome.
Update 9 Feb
- The increased output seen on Thursday afternoon from Pelican Point and statements attributed to AEMO may possibly mean that this station’s second unit could, with sufficient notice, have been brought back into service by Wednesday afternoon had the need been more clearly foreseen earlier – although what lead time would have been necessary is uncertain.. This may – stress may – have obviated the need for load shedding.
About our Guest Author
 |
Allan O’Neil has worked in Australia’s wholesale energy markets since their creation in the mid-1990’s, in trading, risk management, forecasting and analytical roles with major NEM electricity and gas retail and generation companies.
He is now an independent energy markets consultant, working with clients on projects across a spectrum of wholesale, retail, electricity and gas issues. You can view Allan’s LinkedIn profile here. Allan will be regularly reviewing market events here on WattClarity. Allan has also begun providing an on-site educational service covering how spot prices are set in the NEM, and other important aspects of the physical electricity market – further details here. |
Great article Alan. I’m thoroughly enjoying your reviews and learning more about my ezy2view in the process.
Cheers
Great article! Amazing that PPCCGT Unit 2 has been unmothballed so quickly! One of the Port Lincoln units is running tonight as well.
I wonder if AEMO under-forecasting has anything to do with it, they don’t seem to take weekends/holidays into account. Maximum demands were quite low in SA during the last 2 summers largely by chance, no heatwaves culminated on full working days (Mon to Thu), but this year they have done so in both QLD and SA.
AEMO modelling of wind power is more subtle than stated in the article. For one purpose they use a nominal capacity factor, but for the Reliability Standard and the ESOO they use actual wind power data for the previous 6 years, adjusted to 2016/17 levels.
Given that the recall time on Pelican Point’s second unit was obviously a lot shorter than some earlier statements had indicated, I think a higher demand forecast from AEMO either on the day or a day or two ahead may have made a difference on Wednesday. It still would have come down to AEMO issuing a Direction early enough to get the unit online for the evening peak – as they did on Thursday.
I’d be very surprised if AEMO’s forecasting process ignores weekday / weekend differences but the absence of mid week extreme heat in the last two summers would have made calibrating and tuning their models more challenging.
Thanks for pointing out the actual wind-trace methodology AEMO use for ESOO and reliability standard analysis. For the purposes of this quick writeup I felt the simple capacity factor “benchmark” was an appropriate point of comparison, but yes they do adopt a more sophisticated approach in full market modelling.
Allan
Allan, you are my new Font of Knowledge on the grid. Your articles should make it into mainstream media. At least they should be on the daily clipboards of our pollies for digestion.
Some random related comments and questions….
Is AEMO running a corruptable system? Have you seen evidence of the generators being pulled back / taken off line in the face of an impending tight spot? Just to play for the $14k? Do AEMO have people who check the bonafides of any off-lines? Just wondering.
I’m staggered at the increase in demand from hot weather. There must be opportunities for controlling this excessive demand as a cost effective way to avoid load shedding.
Is it true that NSW were about 2GW short of power on the 10 Feb 17 during the worst of their power peak? And that Tomago smelter pulled consumption to avoid cutting power to mums and dads? Did NSW still have to swallow a $14k spot price during this “almost outage”? In Adelaide it was reported as one big ‘back patting exercise’ after people reduced power consumption and averted load shedding, in response to a call from their Premier.
Cheers and regards.
Your article refers to ROLLING load shedding being ordered, but the news casts in Victoria suggested those without power had no power for that whole period.
Were those reports true?
If so why was the withdrawal of power not shared sequentially over various consumer blocks as the term ROLLING implies.?
Robert
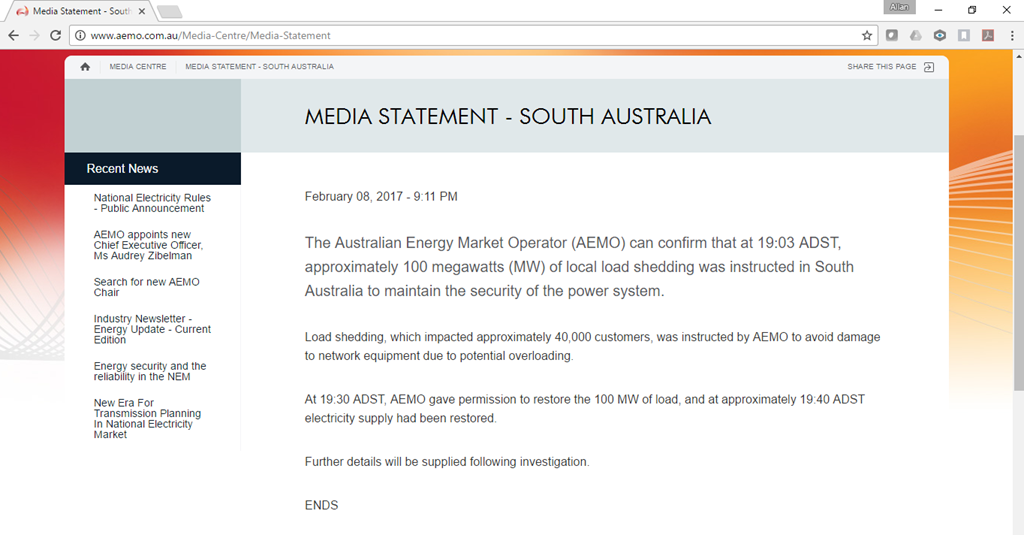
This tweet from SA Power Networks certainly describes the load shedding as rotational ie rolling. AEMO and the relevant authorities in SA (and in every other jurisdiction) would have a pre-approved list of loads / areas to be shed sequentially in this type of event. The duration of such shedding in any particular area would normally be about 45-60 minutes, then power would be restored and the next scheduled area disconnected, and so on. As this event lasted less than an hour, I imagine that only the first load block on the list was affected. AEMO’s media release above states that load reduction applied between 19:03 and 19:40.
Allan