
In this article we unpack what system frequency is and how it is managed.
The cycles of the voltage wave, per second
In electrical systems, such as the NEM, the system frequency is the frequency of the oscillations of alternating current in the network.
The NEM operates at a frequency of 50 hertz (Hz) which means the alternating current should cycle 50 times a second between positive and negative voltage.
A stable system frequency is critical for secure operation of the power system and the safe and effective functioning of equipment connected to the network, including generators.
Frequency fluctuates
System frequency deviates from its nominal value (50Hz in the NEM) when there is a supply or demand imbalance so there is a constant need for it to be well controlled.
If there is an excess of power supply the frequency rises. In the figure below excess supply would represent more weight on the supply end of the balance, tipping the see-saw in the direction that makes system frequency higher.
If there is undersupply (or demand increases suddenly) frequency falls.
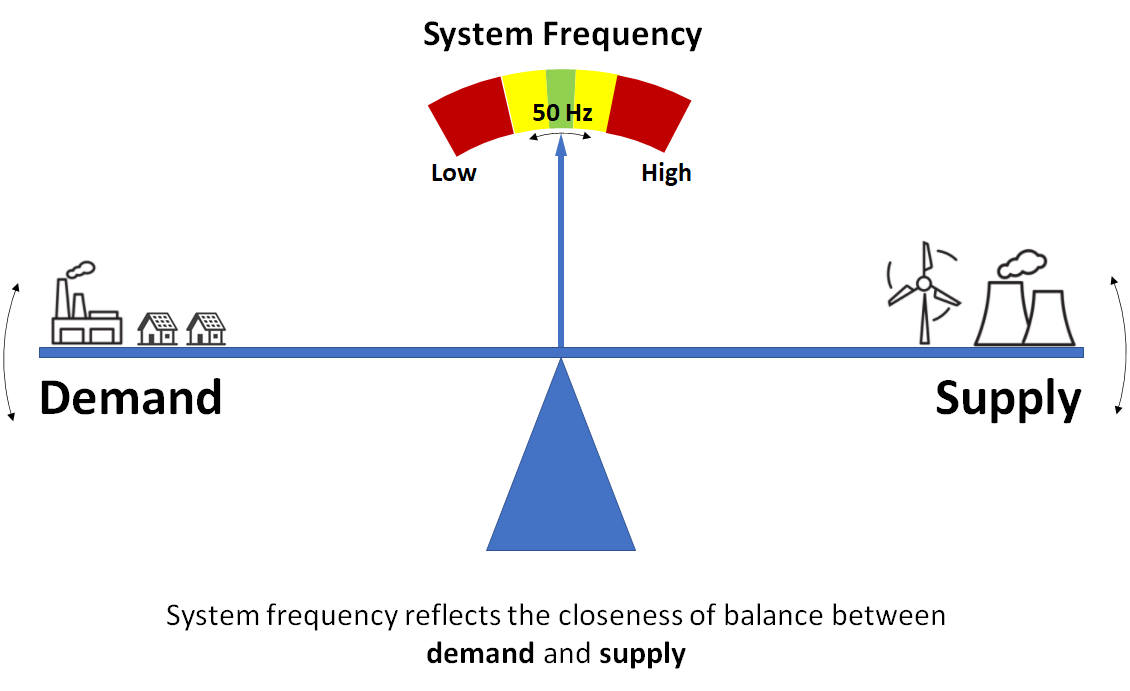
[Diagram source: WattClarity. Representing the balance as a see-saw.]
Frequency fluctuates either side of the target quite often when it is controlled tightly.
The Frequency Operating Standard (FOS) sets the requirements for system frequency in addition to the required system frequency outcomes following specified events. The FOS forms part of the system security standards.
The power system is expected to experience a range of different operating conditions. A comprehensive suite of control capabilities is needed to meet the requirements of the FOS.
Frequency control is an integrated, complementary chain of actions
The NEM market operator (AEMO) notes in its technical white paper for enduring primary frequency response requirements for the NEM:
“Frequency control in modern power systems is comprised of an integrated, complementary chain of actions aiming to retain, recover, then restore frequency to its nominal value following small and large disturbances. This is achieved through the management of active power over different timescales in response to supply-demand imbalances.” [AEMO2021].
Six stages of frequency control in the integrated and complimentary chain are identified in the table below.
Stages of frequency control
| Stage in the chain | Operates | Benefits |
| Inertia | As physical property of the power system that operates all the time. | An instantaneous but passive response to changes in frequency. Reduces the rate of change of frequency following a disturbance. |
| Primary Control
Commencing at small deviations inside the NOFB |
Upon local detection of a frequency deviation. | Fast, automatic active power response, proportional to the deviation and unit capability (“droop”). Active changes in power output to oppose and correct small supply-demand imbalances. |
| Secondary control
“Regulation FCAS” |
Via centrally coordinated instructions, to generators, from the automatic generator control system. | Instructs participating generators to provide a sustained response to return the frequency to 50 Hz, with instructions issued every 4 seconds to manage frequency within the dispatch interval, complimenting primary control. |
| Primary Control
Commencing at deviations outside the NOFB – “Contingency FCAS” |
Upon local detection of a frequency deviation outside the NOFB or via switched response controls. | Triggers responses that come from dispatch-enabled reserves, having allocated headroom or foot room to deliver, that address large sudden frequency deviations over timeframes from 1 second to 5 minutes. Aims to bring frequency back within the normal operating band (NOFB). |
| Tertiary Control
“5-minute dispatch” |
Via central dispatch every 5-minutes. | Addresses generation and demand variability from one dispatch interval to the next through the issue of rebalanced dispatch instructions at each dispatch interval. |
| Emergency Control | Via emergency frequency control schemes that trigger shedding of load or generation. | Controlled shedding of load, generation or storage response rebalance load and generation in the event of sudden, severe, non-credible events. It reduces the risk of further cascading impacts. |
The timescales matter
The NEM uses markets to provide many of these frequency control services.
In ‘The Market’ means different timescales we see frequency control services fulfil their role at much shorter timescales than other services and markets. At longer timescales power system reliability (is there enough supply, and is it reliable, to meet projected demand) and energy security more generally.
Given this, we unpack the six stages in more detail.
Inertia
In Let’s talk about Inertia we can understand how much inertia is present in the NEM, and what role it plays.
The key principle is that it, traditionally, is a property of machines with spinning masses that are synchronised with system frequency. The machines have inertia because they are inclined to remain spinning at a similar speed when there is a change in frequency, rather than follow the change in frequency. It is a passive property that resists any change in frequency, rather than corrects it.
PFR
There is a great background on PFR in What’s “Primary Frequency Response” and why does it matter anyway?. In that article we find a comprehensive discussion on what PFR is and why it was introduced, why it matters.
Readers familiar with the topic may not need any further refresher, but for this author, these questions were helpful to revisit:
- What is PFR?
- It’s a response of an individual generator (or load, or bidirectional unit) to locally detected changes in frequency. Control systems on the generator are set to respond locally (and instantaneously) to low frequency by increasing power output, and to high frequency by reducing power output. The response proportional to the size of the generator and the degree to which the frequency is off-target. These two aspects are linked by the “droop characteristic”.
- How does PFR differ from inertia?
- PFR is an active response to frequency whereas inertia is a passive property that resists changes in frequency. Inertia is typically present in synchronous machines. It “buys time” for active control actionsto correct the underlying imbalance between supply and demand that is driving frequency away from the target.
- How does PFR differ from regulation FCAS?
- It is faster because it doesn’t rely on a centrally managed feedback loop to determine and deliver instructions to units to increase or decrease power in response to frequency.
- How does PFR differ from contingency FCAS?
- Contingency FCAS triggers enabled units to respond when grid frequency goes outside the normal operating frequency band, to bring the frequency back into the NOFB.
Regulation FCAS
Two markets (for raising and for lowering frequency) operate in the NEM. These started in 2001.
Eligible (registered) units make offers to be enabled to provide the service.
Enablement (unit by unit) is set every dispatch interval by the security constrained economic dispatch engine, NEMDE. In other words, every 5 minutes energy, power system constraints and requirements for ancillary service levels (including Regulation FCAS) are met in finding a lowest-overall cost to the solution.
When a unit is enabled for regulation FCAS it receives signals from the central automatic generator control (AGC) system that may be up or down from its base level. These instruct the unit to deliver a change in active power that is aimed at controlling system frequency in accordance with a calculated need.
The Regulation FCAS instructions to enabled units are sent every 4-seconds.
Units that are enabled get paid at the spot price for that enablement, for their enablement level.
Regulation FCAS is discussed further in Let’s talk about FCAS.
Costs recover takes the general principle that units which contributed unhelpfully should pay:
- Costs until June 8 2025 were recovered through the “Causer Pays” approach.
- Costs from June 8 2025 are recovered through new arrangements as part of the primary frequency response incentive arrangements.
A review of how the Regulation FCAS market has operated over time is available at Historical review of Regulation FCAS of use.
How it has been used is an additional topic and this has been review in “Has adding wind and solar upped the need for FCAS in the NEM?”
Contingency FCAS
Eight (8) markets each consisting of raise and lower services, for four different speeds:
- Raise and Lower, at
- 1 second, 6 second, 60 second, 5-minute
- As with Regulation FCAS, eligible units make offers to provide the service. When enabled the units are effectively on standby to respond when needed.
As per the description of each FCAS in the market ancillary service specification – “the MASS”, for a Contingency Event that takes system frequency outside the NOFB:
- The 1-Second Raise Contingency FCAS is designed arrest the change in frequency following the event within the first 1 second of the frequency disturbance. It then provides an orderly transition to a Fast FCAS (the 6-second service).
- The 1-second market was introduced following recognition that the very fast services would be beneficial for frequency control in a NEM with lower inertia due to increasing penetration of renewables.
- The 6-second service can act within the first 6 seconds to deliver its response, taking over from the 1-second response (the orderly transition to the “Fast FCAS”). Its purpose is the arrest the change in frequency.
- The 60-second service acts within the first 60 seconds of the event to stabilise frequency, allowing the orderly transition from the 6-second service.
- The 5-minute service acts to return system frequency to 50 Hz within the first 5 min, and to sustain that response until central dispatch can re-schedule generation and load to balance the power system.
5-minute dispatch
Identified supply/demand imbalances are reset through central dispatch of the energy market. This is made possible because the dispatch interval is 5-minutes.
Demand variability, supply variability and predictability all contribute to (usually minor) mismatches over the dispatch interval, especially over the course of the interval. So, the need for the faster-acting services always remains.
Emergency control
The emergency control loop serves as the ‘last line of defence’ in the event of high impact, low probability contingency events that might otherwise result in widespread and prolonged outage situations if not managed appropriately [AEMO2021].
Key components include:
- Under-frequency load shedding – UFLS – when the response to low frequency is to switch of load.
- Over frequency generation shedding – OFGS – when generation is shed.
A peek at how frequency varies
In the chart below we provide a sample of NEM mainland frequency at different timescales:
- The values represent the deviation in Hz, the aim is to be at a deviation of 0 (zero) Hz.
- Due to the fast-changing nature of the series, longer periods (e.g 1 week) can appear quite busy.
- Note also, the series presented here is well within the NOFB (+/- 0.15 Hz) meaning contingency services would be expected to be inactive, but inertia, PFR and regulation FCAS would be active.
- The dashed lines represent the primary frequency control band of +/- 0.015 Hz). Primary frequency response operates outside this band.
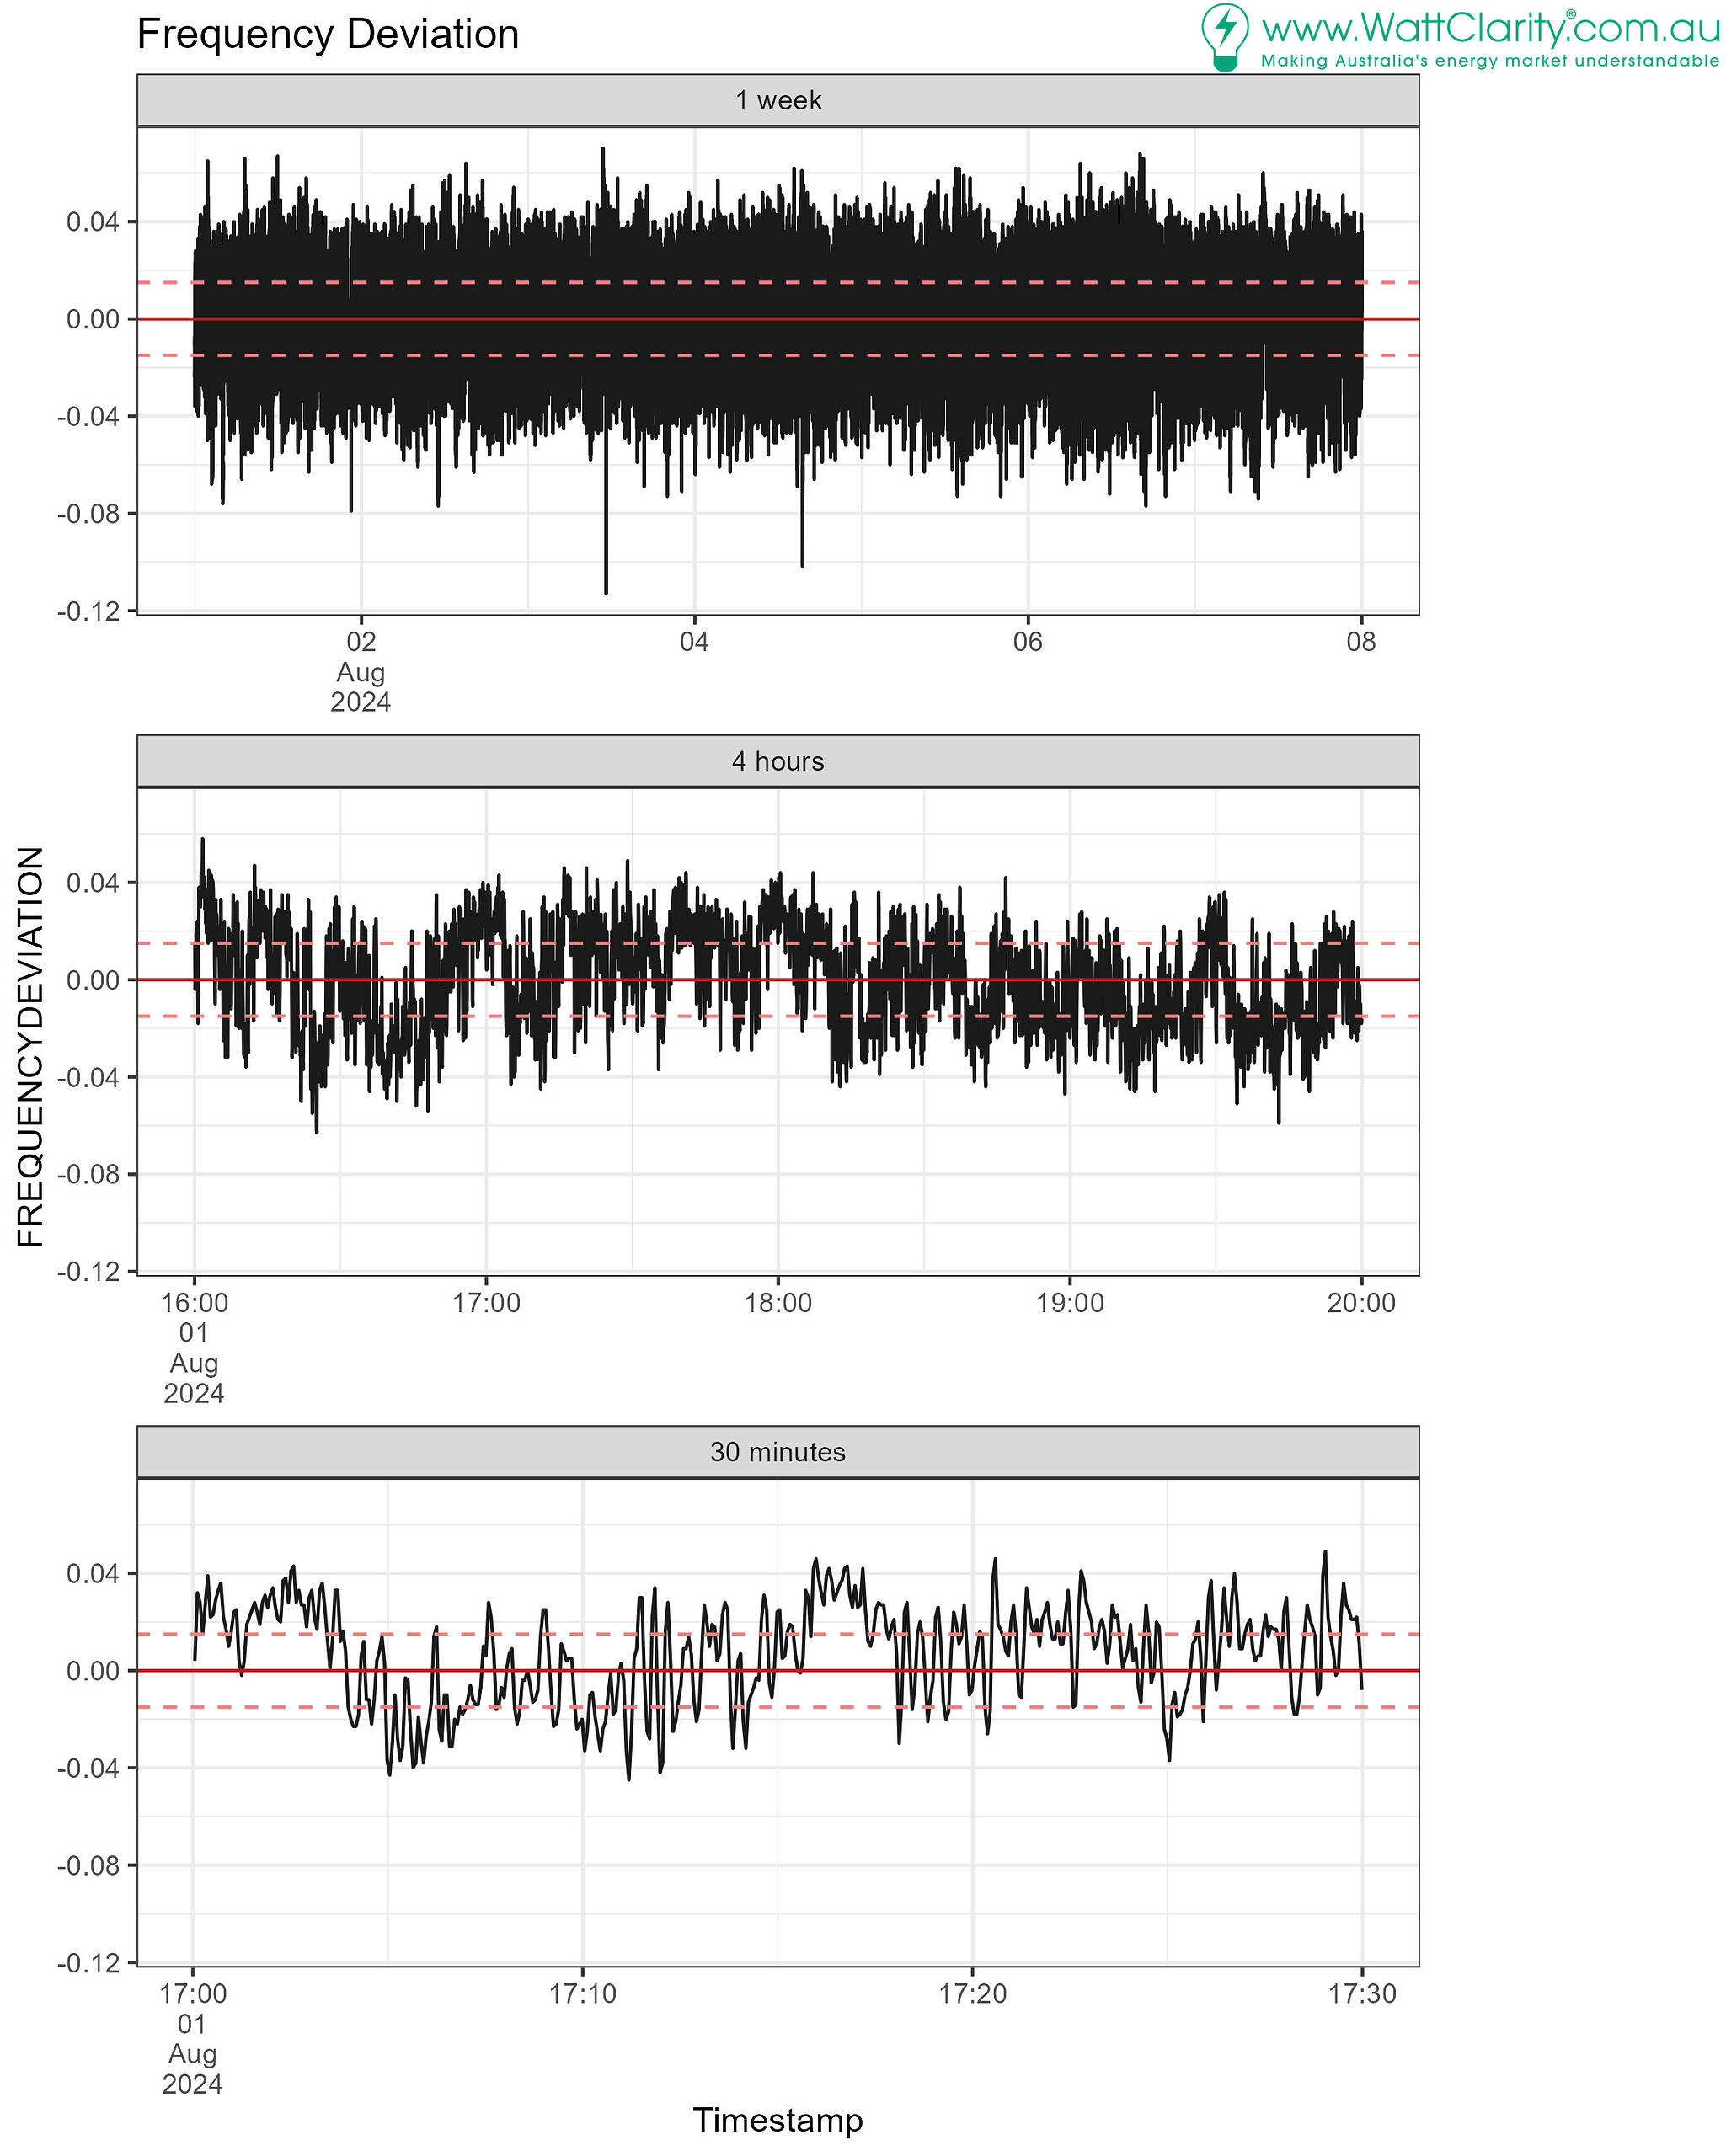
A sample of mainland NEM frequency deviations using 4-second samples.
Great article. One minor point:
The frequency diagram seems to have ‘low’ and ‘high’ back to front assuming the fulcrum and the horizontal bar are rigidly coupled together.
Supply up or demand down = frequency rise (not fall)
Supply down or demand up = frequency down (not rise)
Hi Robert, thanks for reading and commenting! I also took that view, initially. The reason I say initially is that upon reflection (in the course of writing the article) I realised the diagram represents the balance as see-saw. Adding supply (supply up), makes that side heavier on the see-saw, and that tips the frequency pointer to the high side.