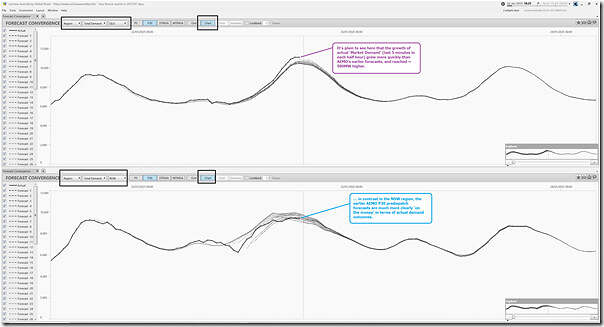
We’ve just noted how ‘New all-time-maximum ‘Market Demand’ seen in QLD on Wednesday 22nd January 2025’ so a logical question for many would be ‘how does this compare to the AEMO forecasts’.
With the ‘Forecast Convergence’ widget in ez2view, we can see that easily – such as in this snapshot for the 18:25 dispatch interval (NEM time) looking at AEMO’s successive forecast for P30 Predispatch.
1) Note that I’d most often use the ‘Grid’ view to allow one to ‘look up a vertical’ in order to ‘see that other dimension of time’.
2) But in this case the ‘Chart’ view provides a clearer picture.
In this case we see:
1) At the bottom, AEMO’s earlier P30 forecasts for ‘Market Demand’ for NSW came in pretty much ‘on the money’
2) But in contrast in QLD:
(a) The growth in QLD ‘Market Demand’ was earlier* and more rapid than the AEMO’s earlier P30 predispatch forecasts
(b) And they certainly reached a higher level!
* note that learned readers have previously pointed out that, because of our way of dealing with the quirks of Tripwire #1 and Tripwire #2 (which result from AEMO’s technology-constrained implementation of 5MS) it can sometimes appear that the demand is growing earlier than expected, because the ‘actuals’ are the the last 5 minute data point in the half-hour whereas (for ‘Market Demand’ per Tripwire #2) the forecasts are more a mid-point or average in the half hour.
… so readers beware!


Leave a comment