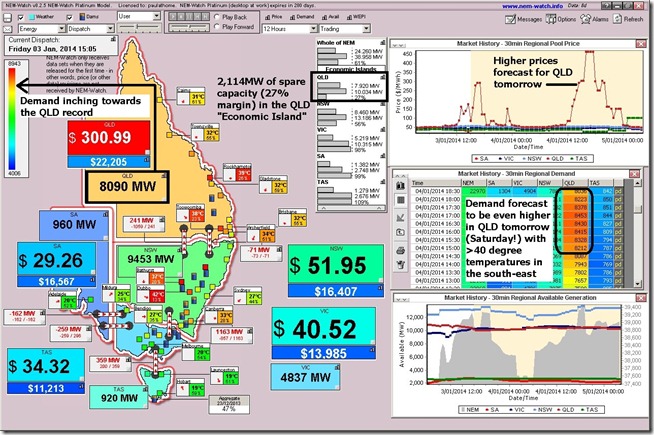
The heatwave that has been afflicting central Australia for days arrived in the coastal areas of Queensland today and helped to drive regional demand into the Orange zone across the Queensland region, as shown in this snapshot of 15:05 NEM time taken from NEM-Watch:
About Friday 3rd January
As can be seen in this snapshot, the demand in QLD at the time was 8,090MW on a dispatch target basis – only 800MW or so below the all-time record for the region (hence the orange alert colour for the region, and the region demand box).
At the time of posting, we note the demand had climbed further to 8,213MW at 16:05.
We can see that the plentiful spare capacity that QLD normally enjoys has been whittled down somewhat, leading to a 27% Instantaneous Reserve Plant Margin (IRPM) in the QLD “Economic Island” which, when coupled with some transmission constraint activity, is enough to deliver a few price wobbles (though, at the time of writing, the price had not fully exploded).
In a tale of two markets, we see the inverse happening in South Australia, where windy conditions have delivered significantly cooler conditions which, when coupled with high output from wind farms in the region, have driven dispatch target demand* below 1,000MW (hence the deep blue alert colour for that region).
* Dispatch Target Demand = the scheduled demand that AEMO has to meet in scheduling market generators.
About Saturday 4th January
Of particular interest in this snapshot is the area of the table highlighted in the snapshot where we see that the forecast demand in Queensland for the following day (a Saturday!) is forecast to be as high as 8,453MW at 17:00 NEM time.
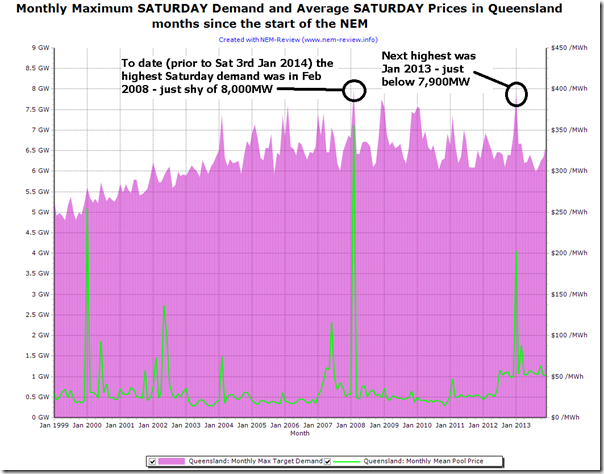
With a quick reference to this analysis from NEM-Review, where we have filtered the full range of NEM history to look only at Saturdays, we see that (if this was to eventuate) this would represent the highest demand QLD has ever experienced on a Saturday:
As noted in the diagram, the two times where the Saturday demand levels have been significantly high in the past (though still more than 450MW below the level forecast for tomorrow) were as follows:
1) On Saturday 22nd February 2008, where we saw significant market activity as documented here at the time, and discussed shortly afterwards at this conference.
2) On Saturday 12th January 2013, part of the “wacky weekend” where we saw remarkable volatility experienced as one part of a very remarkable summer (see here for an animation of a couple hours on that day).
We’ll NEM-Watch with interest tomorrow, to see what unfolds …
For the remainder of summer?
Entries are streaming in, now, from market analysts and observers keen to test their skill and earn bragging rights (and win a 6-burner BBQ as well) by being named “Best Demand Forecaster in the NEM”.
If you have not already posted your entry, you have until C.O.B. Monday 6th to do this – by following the instructions here.


Pardon my ignorance…but is this high, near record demand happening in spite of the high solar pv penetration in QLD? I had thought the solar influence would have considerably flattened the peak load curve which I presume is largely caused by air-conditioning.
Hi Neil
Thanks for the question.
How demand grows (or declines) is a result of the interaction of many factors – some supporting growth, some promoting decline.
1) A couple years ago we posted about these factors that were coming together to deliver the decline in (average and peak) demand seen in the past few years;
2) More recently, Hugh Saddler has put together this detailed analysis that highlights the magnitude of the effect these factors are each having on demand suppression.
Interestingly, the effect of solar PV is currently, according to Hugh’s numbers, five times less significant than the most significant factors (i.e. 7% contribution compared with 37% to a decrease from Business as Usual). I’d stress that this is “currently”, as it may be that the effect of solar might rapidly increase, if the take-up rate continues as it has in the past couple years – though, as Ric noted here, there has been a cooling in the take-up rate despite decreasing installed costs.
So, Neil, in answer to your question – scheduled demand (which AEMO has to meet in dispatching the market) would have been higher without the PV that’s operational now, but the amount of PV that’s currently installed is too small to prevent such peaks ever* occurring.
* as to whether or not that would be a good thing – economically or environmentally – each reader will have their own personal point of view
Does this answer your question?
Paul
thanks Paul. Yes it does. I had obviously thought that solar pv was having a more significant impact. I will read Hugh Saddler’s report and others you’ve referred to.